Colour Code Table Cells

Would be great if table cells can be colour coded for easier visualisation. At the moment, my imported Google sheet documents for project management eg RACI charts, Gantt chart, risk matrix etc have no coloured cells. Add these items to the existing Grist project template and BOOM!

4 Likes

@Len_Kwok If some of your columns can be converted to Choice or Choice Lists, then you can color-code them - you can read about it in our July newsletter or see them in operation in the Grant Application Tracker template.

1 Like

Wow, thank you, that is very helpful.

Len

2 Likes

Nice seeing you on the forum, Len! :grinning:

Here is an example of adding color to rows by including a colorful tag as a calculated Choice column: ​​​https://public.getgrist.com/sYzrCN8H5kg7/Conditional-Color-Tags/m/fork.

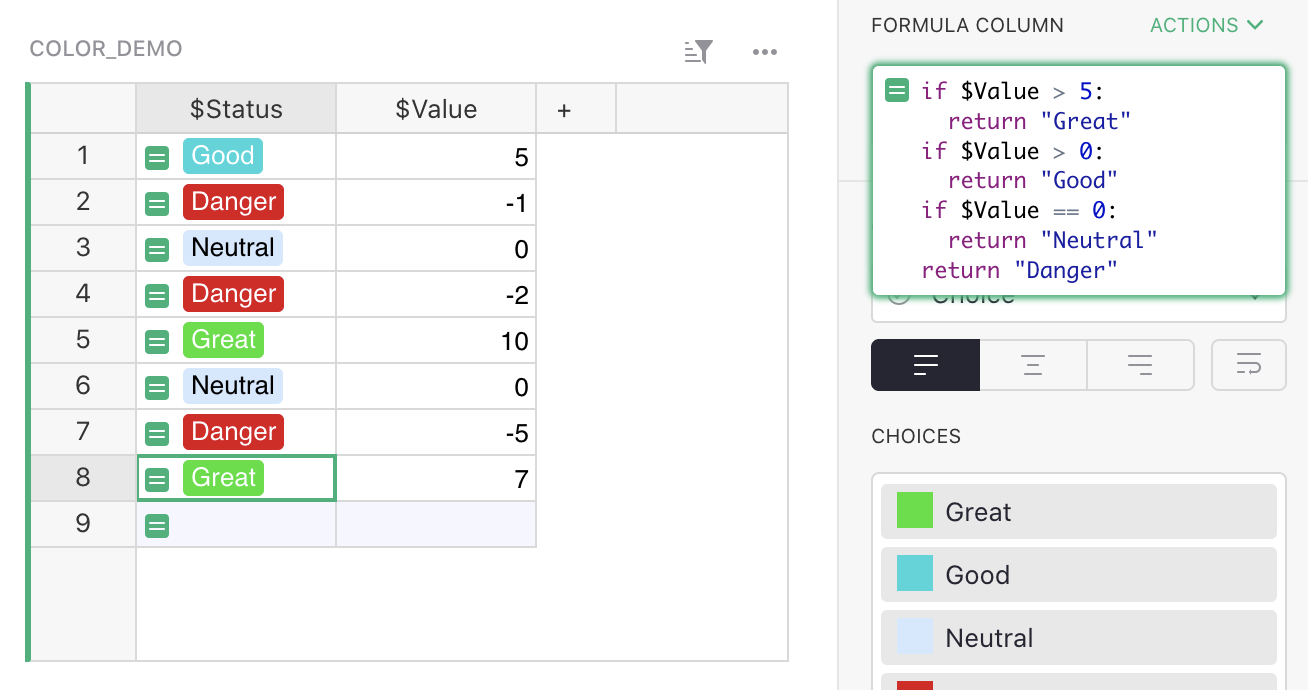
Here, the column “Value” determines the choice in the column “Status”. The Status values show up in colors that are configured in the creator panel on the right (see Choice column type), and the conditions are specified using a formula.

3 Likes

Would really like to see this as well. In my case I’m using a Google Sheet to keep track of some speakers at events. I have one row per events and 3 speakers on each. The individual cells are then colour coded depending on whether I have contacted them, if they’re provisionally scheduled or if they’re confirmed.

This doesn’t work on Grist because I would have to create three new cells which is clunky and frankly not quite as at-a-glance obvious.

Hi Brian. Welcome to the forum!

In your case, it might be easier to break out each speaker into their own row and create a Choice Column that lists whether they’ve been contacted, scheduled, or confirmed. I mocked up an example here:

https://docs.getgrist.com/doc/new~4gyqwsAyhYqj2w4Hwfmcqx/p/3

Clicking on each event in the dashboard pulls up relevant speaker info. On the right, you can see status at a glance. On the bottom, relevant info in a card view.

This also gives you more flexibility around # of speakers per event. Adding more speakers to an event doesn’t require another cell with conditional formatting.

Thanks for this use case! :muscle:

Hi Anais.
Thanks for the example. Having separate rows is exactly what I’m trying to avoid though :slight_smile: I want a way to see a bunch of events and understand their status at a glance.

Nothing against Grist but I think right now this is one use case it’s not suited for. Being able to colour-code cells makes a lot of information very glanceable so hopefully it might get added to the roadmap.

2 Likes

Ah, I see. Conditional formatting is on the roadmap! You may track our progress here: Conditional formatting · Issue #79 · gristlabs/grist-core · GitHub

Excellent, thanks. Just to be awkward can I put in a request for manual formatting as well? Being able to highlight specific cells so they draw attention or give state is important in my opinion.

1 Like

Makes sense! It’s useful. I’ll add to our list of requested features.

Note that conditional formatting allows manual formatting. You add a column of checkboxes and cells get highlighted when the box is checked. Also means if you change your mind about the highlight color, all cells will be updated!

Conditional formatting is here! :tada: Learn more in our help center: Conditional Formatting - Grist Help Center