Hey there,
first of all, let me say a big thank you to the whole community, at least the founder of GRIST. Im so grateful for this tool which is changing my whole work and life.
Unfortunately, the excel age has passed me by without a trace…
Question:
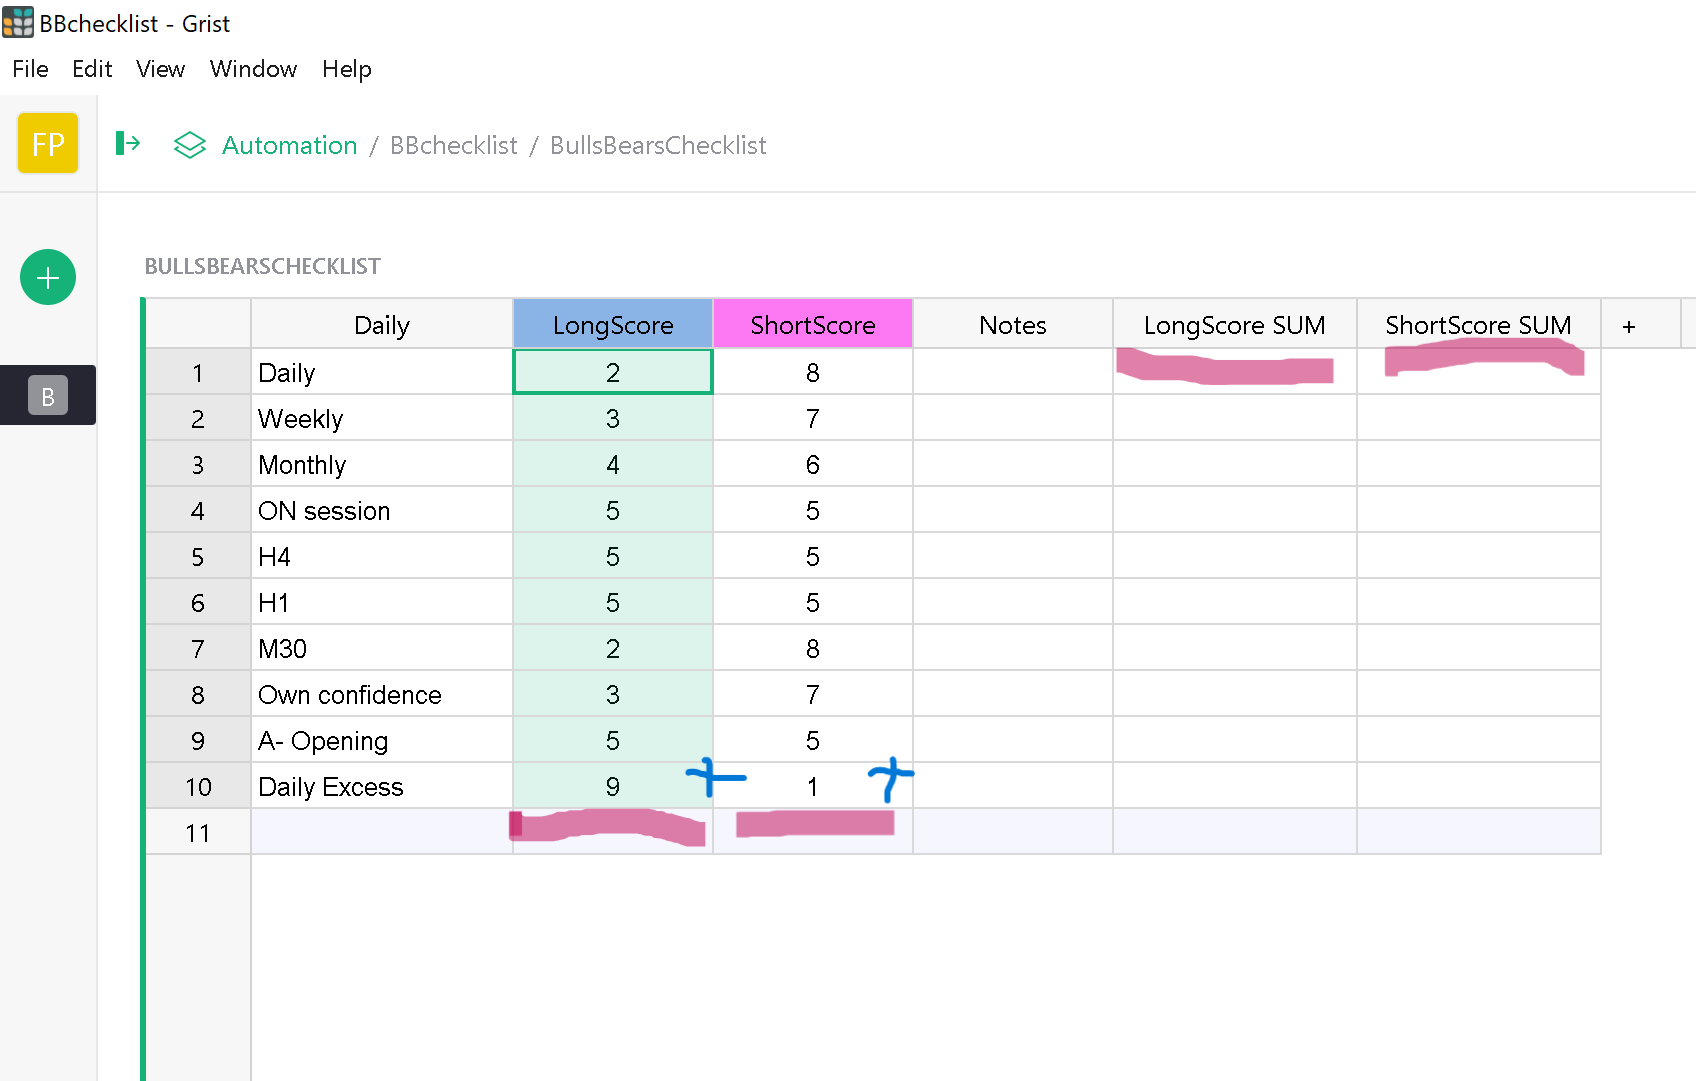
I would like to add 10 (LongScore column) numbers at the point I have marked in the attached picture.
But it doesn’t seem so easy.
Can you help a desperate artist?
Thank you so much girls and boys.
M. from munich
Hi there,
You’ll want a summary table. They let you get table-wide totals or any subtotals.
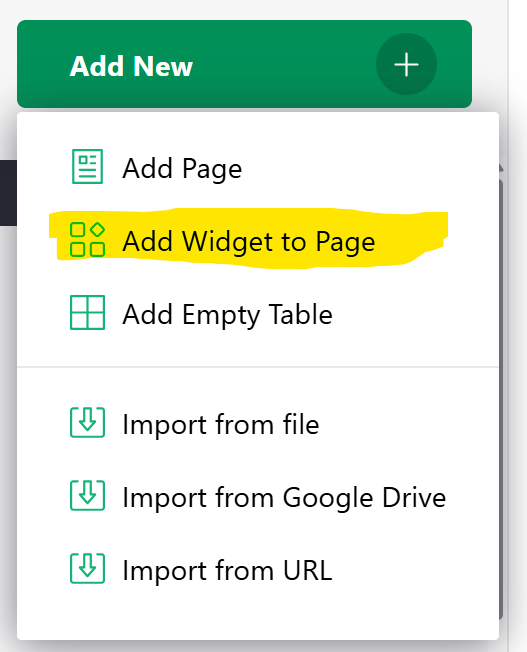
Click the green ‘Add New’ button and ‘Add widget to page’
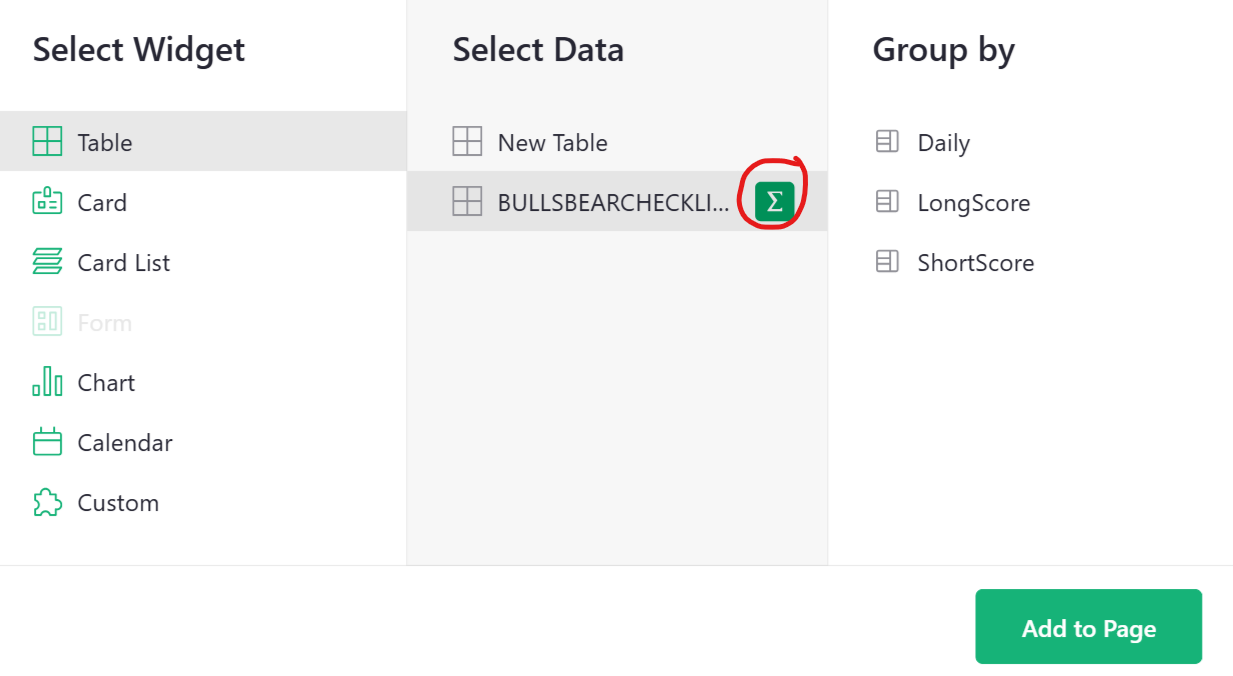
Leave the selected widget as ‘Table’. Then, click the green summation icon to the right of the table you wish to summarize. This expands some options to ‘Group by’ but we want to find table-wide totals so no need to select anything here. Click the green ‘Add to Page’ button.
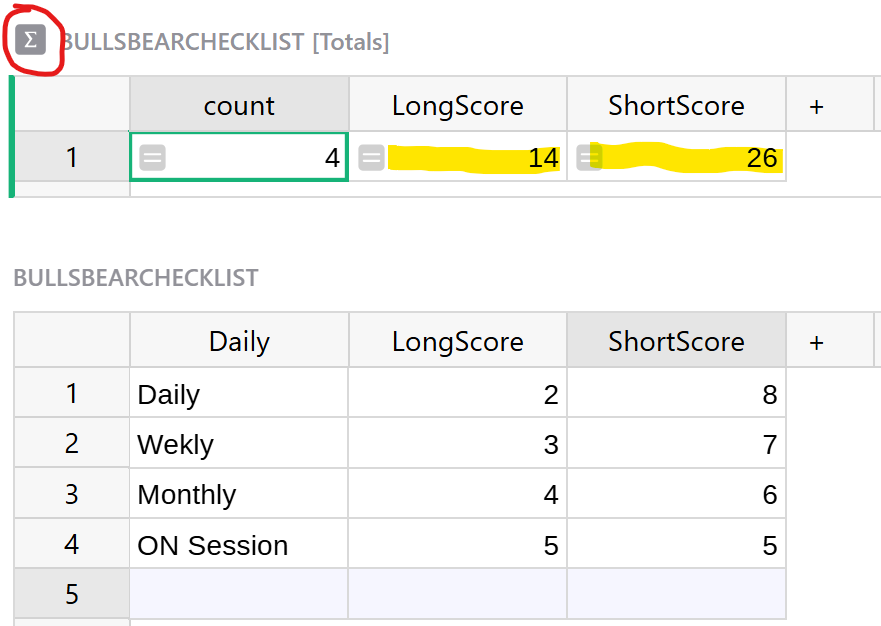
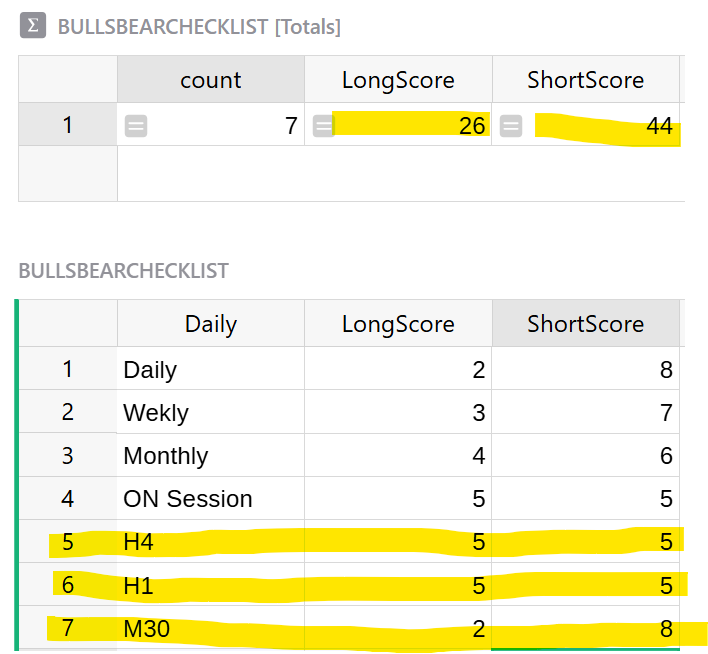
This adds a new summary table to the page (noted by the summation icon next to the widget title, circled in red). Any numeric columns in the underlying table will be summarized so we see totals for LongScore and ShortScore.
As data is added to the underlying table, the summary table will automatically update to reflect those changes. In the screenshot below, I’ve added three new records to the underlying table. The summary table automatically updates to include those records.
Our Analyze and Visualize tutorial is great for a walkthrough on different things you can do with summary tables, including how to group-by a column, as well as linking tables and charts! Check it out here: Analyze and visualize - Grist Help Center
2 Likes
Did it. Its working. Thank you so much for your time and effort Natalie.
I will take a look at the webinars.
M.