Hi… I know the Advanced Charts are not REALLY from Grist, Grist is just using the module.
But if anyone knows how to do this…
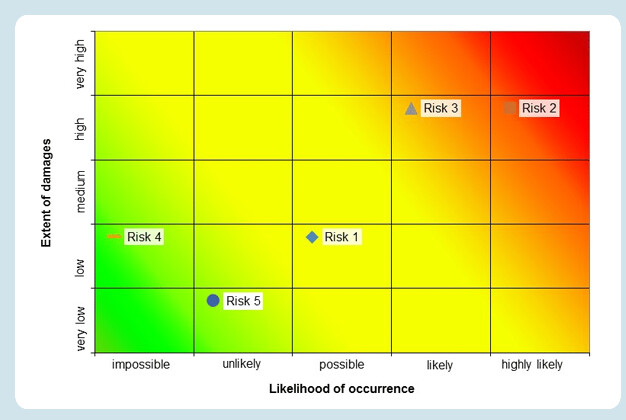
I wanted something like this
a matrix of risks, color coded, where each risk is at it’s “place” in the matrix.
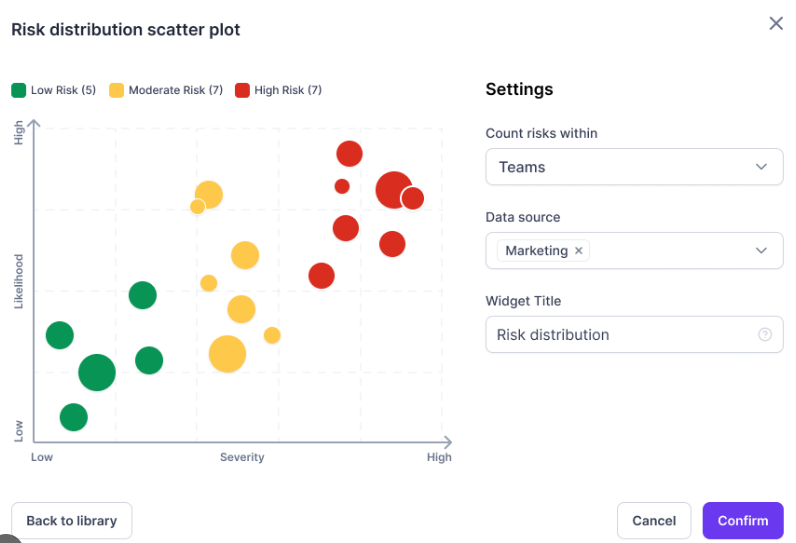
something like this would also be adequate
even better… for a specific risk, to have it’s history in the matrix (as it’s impact and probability change at each analysis). So same matrix background, but as we are looking at a single risk, I would like to see plot points, connected by lines, each point with a date.
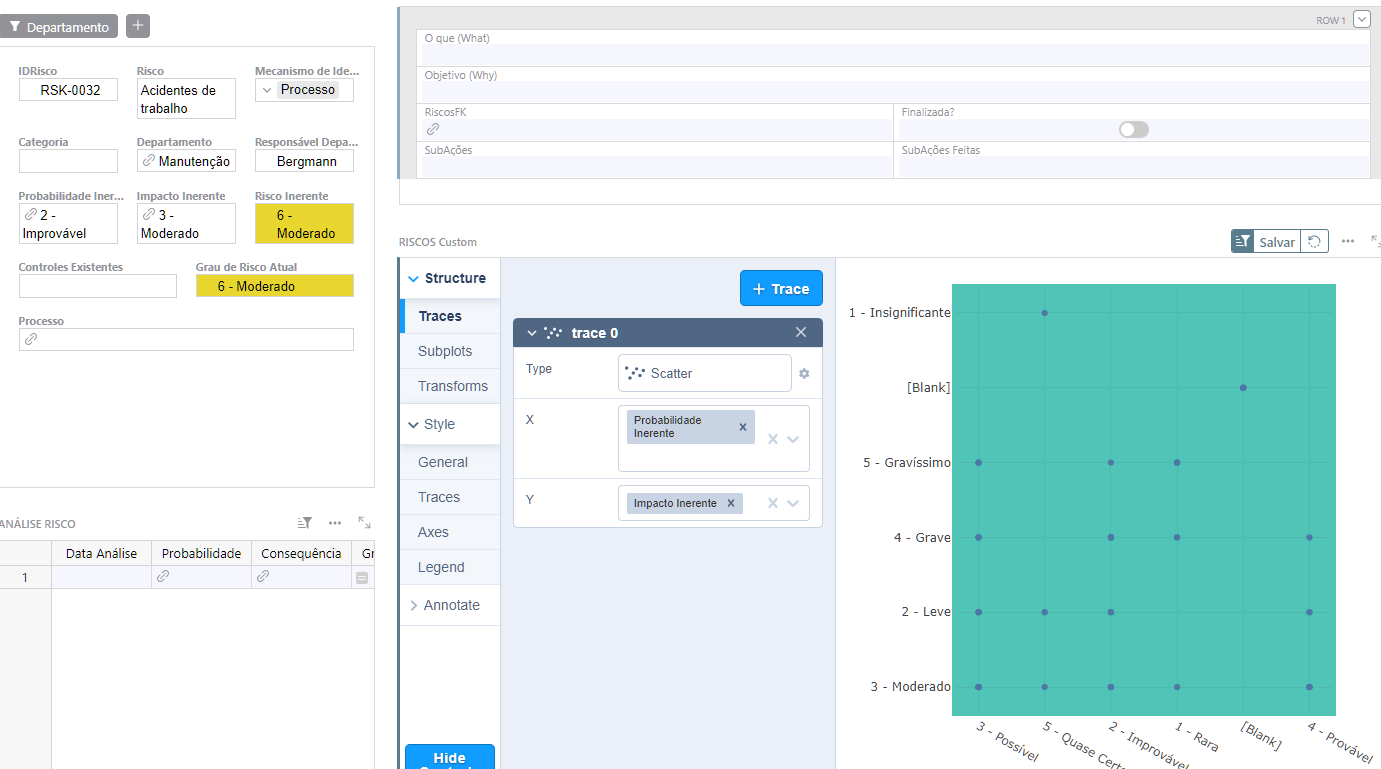
but this is what I got, at best lol