This is a basic HTML reporting example for Grist. It features the ability to sort a table on any column you like, filter records and create a summary line of counts & totals. Also it has a flexible data driven structure for sorting and filtering that allows several different combinations of reports to be select-able from a single table. It is designed so you can plug your own filtering and columns into the formula to customize it for your own tables. However at least a beginner’s knowledge of Python & HTML would be very helpful.
Here is a link to the sample document so you can see it in action: HTML Report Example - Grist
Limitations
What it doesn’t currently do is group lines on the report nor does it work against multiple tables - it is built to report on one table. Also since formulas in Grist are repeated in every row you are limited in what reports one table can produce. If you want to change the filtering query, for example, you would need to create a new Reports table with an altered HTML column formula.
How it works and how you can customize it to make your own HTML reports:
Note, I am NOT a Grist or Python expert and the code is designed so you can swap in your fields and maybe tweak the HTML a bit, not for efficiency or brevity.
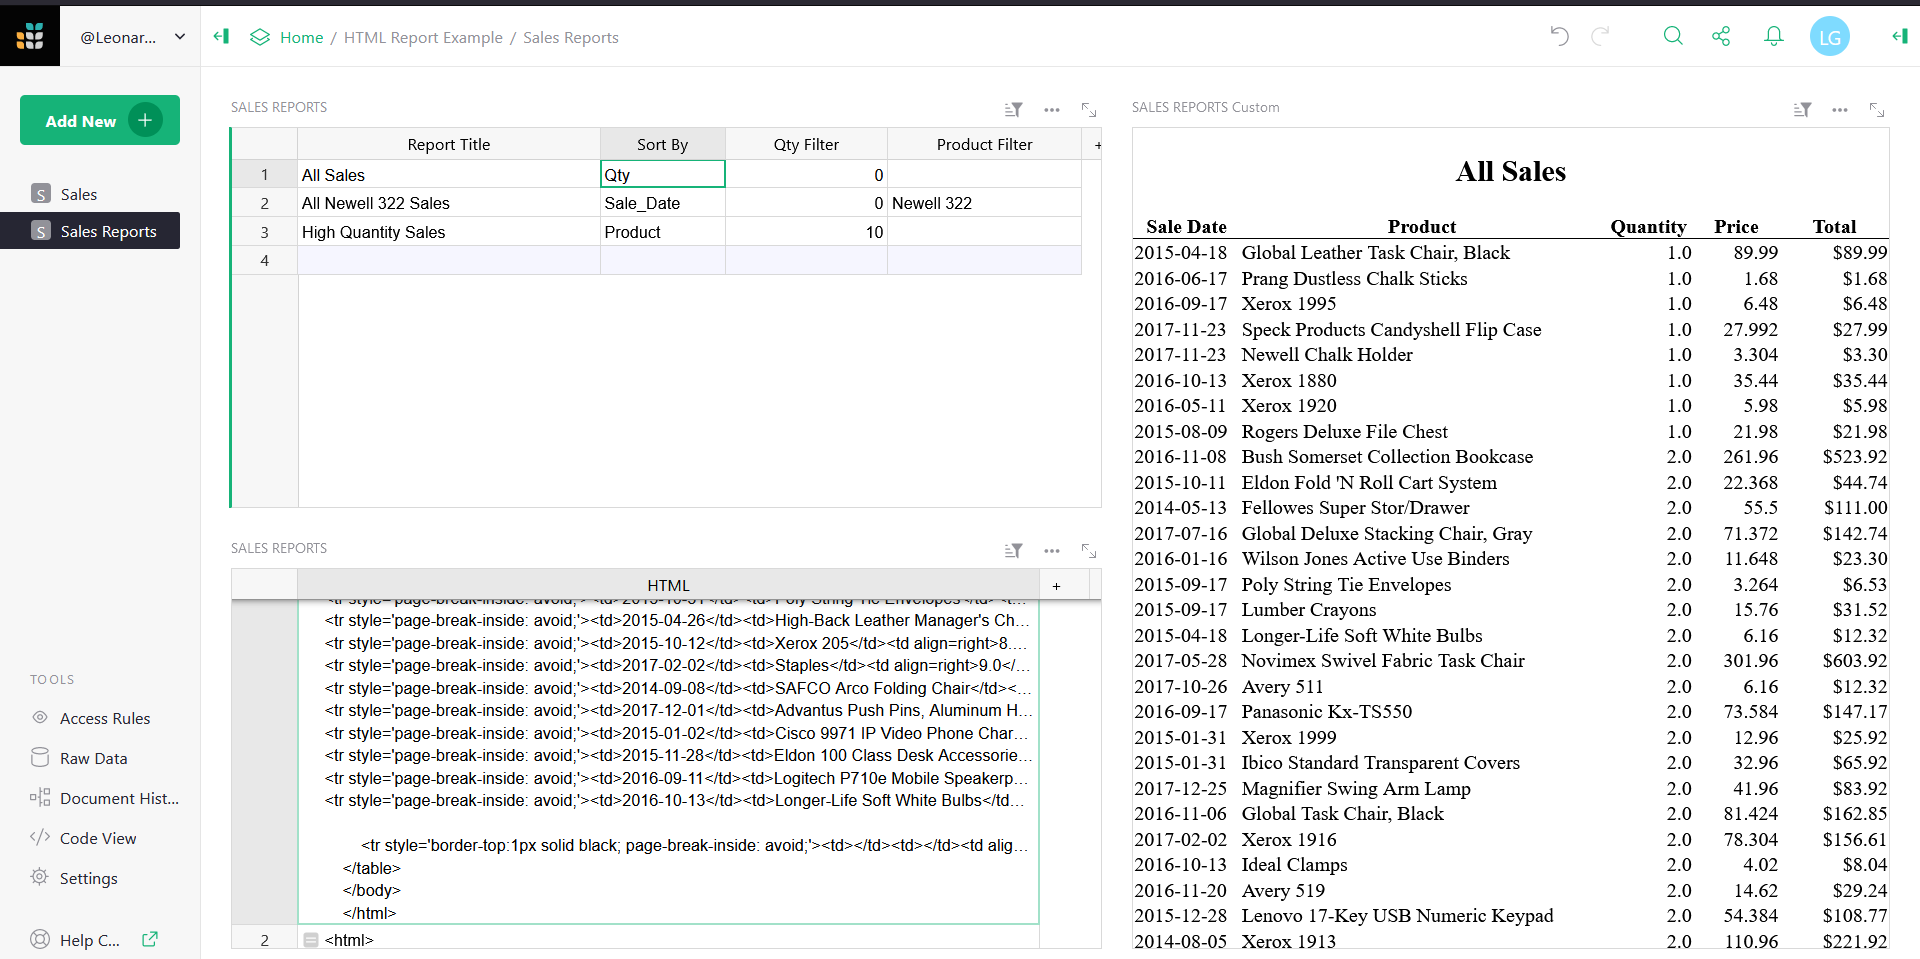
This example is based on a table named “Sales” with these fields: Sales Date, Product, Price, Qty and a calculated field Total Sale. The Python code below references these fields so you can see how to swap in the names of your table & fields. There is also the “Sales Reports” table. It has the columns Report Title, Sort By, HTML (which holds the generated HTML for the custom HTML widget) and two columns (Qty Filter and Product Filter) I named based on their use in filtering this report’s data. You will probably have different filters and would want to call these something different.
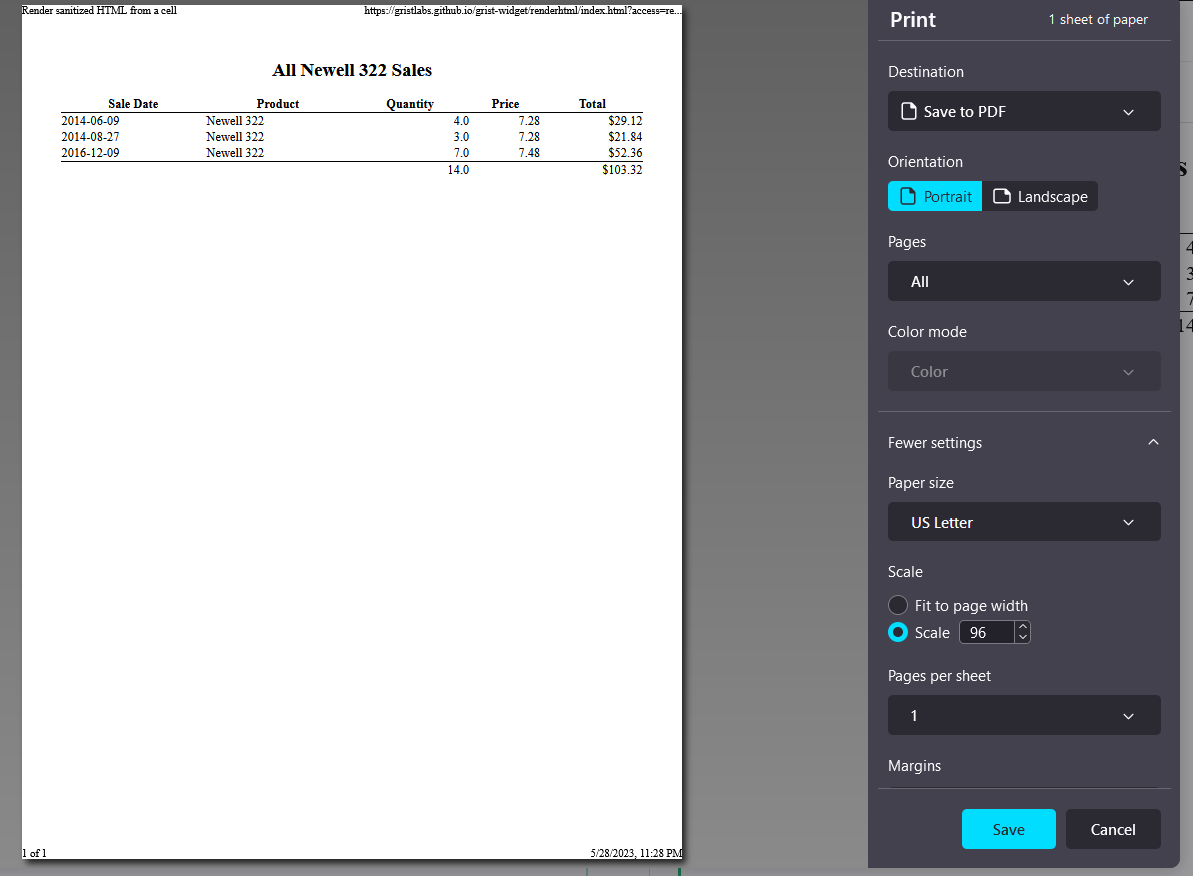
To create a new report in this example document, you enter a Report Title entry which is turned into an HTML header for the report. Then enter the column name of the table you are reporting on you want to sort by in the Sort By column. Finally in this example you enter a filter Qty (quantity) and Product name to limit the data on the report. Right now the Python formula filters based on Quantity greater than whatever you put into the Qty Filter column and limits the Product to whatever you put into the Product Filter column (unless you leave it blank, then it returns all Products).
To customize the HTML formula for a different table you would:
- In the #HEADERS section add/change/delete all of the column title lines that look like the sample below to whatever column titles you want on your report:
header = header + '<th>' + "Sale Date" + '</th>'
header = header + '<th>' + "Product" + '</th>'
Note the <th> and </th> codes help build the HTML table structure and you probably shouldn’t change those. You would likely want to alter “Sales Date” and “Product” part
- Add/change/delete any variables that will be totally up your report’s totals & counts by changing the Python variables like these in the # TOTALS section
qtyTotal = 0
salesTotal = 0
Note: Because we are custom filtering our rows, we have to have Python do all of our counts and totals. These are just two sample totals I put in to give you a code example
You will also need to alter the Python code that totals these fields:
    # Add values for our summary line
    qtyTotal = qtyTotal + r.Qty
    salesTotal = salesTotal + r.Total_Sale
-
Change the table name (here Sales) to your table name:
for r in Sales.lookupRecords(sort_by=$Sort_By): -
Change or delete the filter line to however you want to filter your report. You will probably also want to change the column names in the Reports table (Qty Filter and Product Filter) based on what you are filtering on:
if r.Qty > float($Qty_Filter) and (r.Product==$Product_Filter or $Product_Filter==""): -
Change the column names in the # ROWS section to match the columns in your table you want to report on - lines that look like these:
detail = detail + "<td>" + str(r.Sale_Date) + "</td>"
detail = detail + "<td>" + r.Product + "</td>"
detail = detail + "<td align=right>" + '${0:.2f}'.format(r.Total_Sale) + "</td>"
Note that some HTML alignments and Python conversions and formatting are being used. I tried to give some examples which would be helpful with number and date columns
- Change the summary row lines to output your counts & totals in the proper column of the HTML table. In the sample these are the variables qtyTotal and salesTotal. These summary lines look like this:
summary = summary + "<td></td><td></td>"
summary = summary + "<td align=right>" + str(qtyTotal) + "</td>"
Note: the HTML "<td></td><td></td>" is being used to skip columns I am not totaling
- Finally, if you want, you can alter the HTML of the header, detail and summary sections by altering the contents of the headerFormat, detailFormat and summaryFormat variables. I tried to keep all the important HTML bits in these Python variables for easy tweaking. Some HTML formatting is also done on title & individual detail lines too, however.
Formula in the HTML column of the Sales Reports table:
# REPORT TITLE

title = "<center><h2>{title}</h2></center>".format(title = $Report_Title)

# HEADERS

# Header row format
headerFormat = "<tr style='border-bottom:1px solid black; page-break-inside: avoid;'>"
# Build up the Header HTML - change the column names below
header = headerFormat
header = header + '<th>' + "Sale Date" + '</th>'
header = header + '<th>' + "Product" + '</th>'
header = header + '<th>' + "Quantity" + '</th>'
header = header + '<th>' + "Price" + '</th>'
header = header + '<th>' + "Total" + '</th>'
# Add additonal header columns here...
header = header + '</tr>\n'

# Table row style added to each new row of the table
detailFormat = "<tr style='page-break-inside: avoid;'>"

# SUMMARY

# Totals for summary line - change as necessary for columns you are using
qtyTotal = 0
salesTotal = 0

# ROWS - Change the table & column names as necessary

# Build up the rows HTML - change the column names & formatting below
detail = ''
for r in Sales.lookupRecords(sort_by=$Sort_By):
  # Optional Filter line
  if r.Qty > float($Qty_Filter) and (r.Product==$Product_Filter or $Product_Filter==""):
    detail = detail + detailFormat
    detail = detail + "<td>" + str(r.Sale_Date) + "</td>"
    detail = detail + "<td>" + r.Product + "</td>"
    detail = detail + "<td align=right>" + str(r.Qty) + "</td>"
    detail = detail + "<td align=right>" + str(r.Price) + "</td>"
    detail = detail + "<td align=right>" + '${0:.2f}'.format(r.Total_Sale) + "</td>"
    # Add additonal detail columns here...
    detail = detail + '</tr>\n'

    # Add values for our summary line
    qtyTotal = qtyTotal + r.Qty
    salesTotal = salesTotal + r.Total_Sale

# Build up the summary line for our counts & totals
summaryFormat = "<tr style='border-top:1px solid black; page-break-inside: avoid;'>"
summary = summaryFormat
summary = summary + "<td></td><td></td>"
summary = summary + "<td align=right>" + str(qtyTotal) + "</td>"
summary = summary + "<td></td>"
summary = summary + "<td align=right>" + '${0:.2f}'.format(salesTotal) + "</td>"


# Plug Title, headers and detail rows and summary into the main doc HTML
return """<html>
<body>
    {titleline}
    <table width="100%" style="border-collapse:collapse;">
    {headerline}
    {detaillines}
    {summaryline}
</table>
</body>
</html>""".format(titleline = title, headerline = header, detaillines = detail, summaryline = summary)