Hello Grist super heroes !
I’m trying to create a basic plotly custom widget.
I’m quite low skilled for js but anyway I’ve tried.
Here is what I manage to do (thanks gpt-4)
<!DOCTYPE html>
<html lang="en">

<head>
  <meta charset="utf-8">
  <title>My Grist Chart Widget</title>
  <!-- Include Plotly.js library -->
  <script src="https://cdn.plot.ly/plotly-latest.min.js"></script>
  <script src="https://docs.getgrist.com/grist-plugin-api.js"></script>
</head>

<body>
     <!-- Create a container element for the chart -->
     <div id="chart-container"></div>
     <script>
       // Wait for the Grist API to be ready
       grist.ready();

       // When a new record is selected in the Grist table, render a chart based on its data
       grist.onRecord(function(record) {
         // Extract the data you need from the Grist record object
         const data = record.myDataColumn;

      // Define the trace for the chart
      const trace = {
        x: data,
        type: 'bar',
      };

      // Define the layout of the chart
      const layout = {
        width: 400,
        height: 300,
        margin: { t: 0, r: 0, b: 30, l: 30 },
        xaxis: { title: 'My Data' },
        yaxis: { title: 'Count' },
      };

      // Create the chart using Plotly.js
      Plotly.newPlot('chart-container', [trace], layout);
    });
  </script>
</body>

</html>
This plot a basic chart for each array in a cell (record). How can I change this to transform so data map the column values in an array (wherever the cursor is) ?
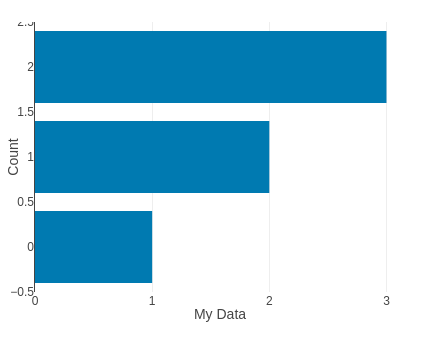
Can you tell me more about what you are trying to achieve? Your code looks ok, it should render a chart like the one below. Maybe the problem is with myDataColumn, if it contains an array, it should be of Any type, otherwise it will be passed as a string to the custom widget.
Yes I confirm the custom widget is working well but not the way I want to.
My goal is to familiarise with custom widget.
And enabling plotly or other librairie to plot different kind of charts.
All different possibilities will be implemented later (column mapping, type of chart,…) if I can.
For now, with this code all values must be passed as an array in a cell with type any as you said.
I’d like to work with scalar values of type integer or numeric in the column and to plot them.
So I need to retrieve all the scalar values of myColumnData then transform it to an array and pass it as data to plotly js, but I do not know how to retriever all scalar values of the column (type = numeric or integer)…
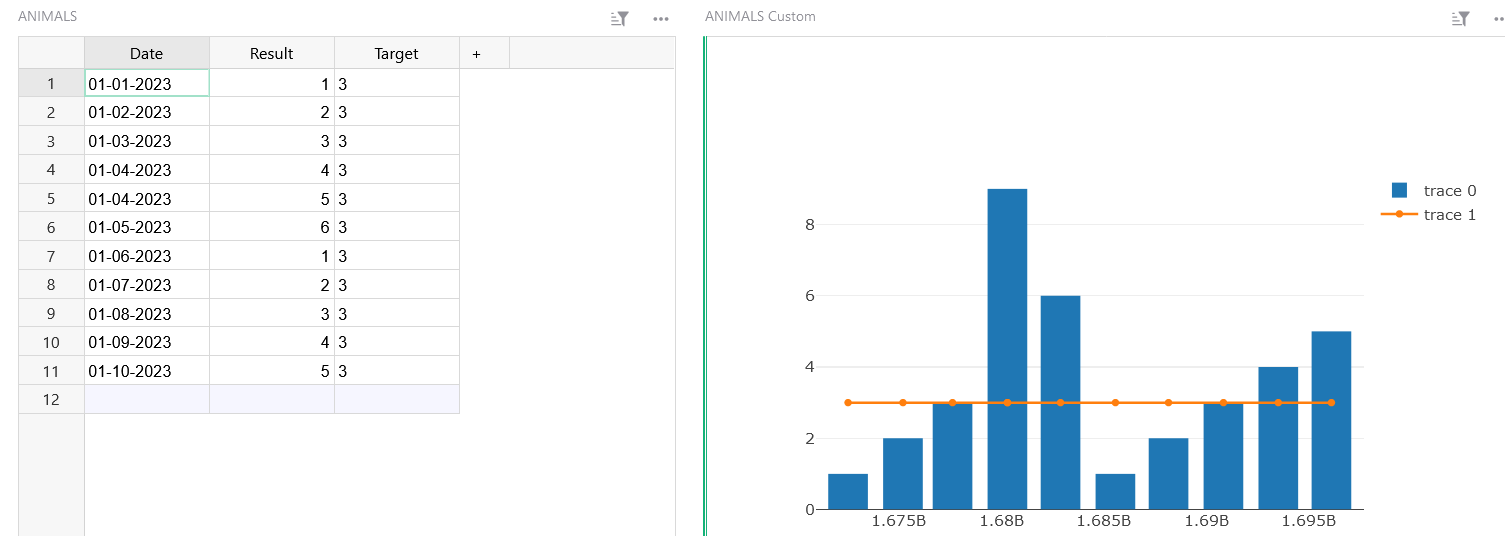
Just a short follow-up.
I finally understood few basic concept of javascript and made this kind of customwiddget
<!DOCTYPE html>
<html lang="en">

<head>
  <meta charset="utf-8" />
  <title>My Grist Chart Widget</title>
  <!-- Include Plotly.js library -->
  <script src="https://cdn.plot.ly/plotly-latest.min.js"></script>
  <script src="https://docs.getgrist.com/grist-plugin-api.js"></script>
</head>

<body>
  <!-- Create a container element for the chart -->
  <div id="chart-container"></div>
  <script>
    // Wait for the Grist API to be ready
    grist.ready();
    // When a new record is selected in the Grist table, render a chart based on its data
    grist.onRecord(function (record) {
      // Extract the data you need from the Grist record object
      let data;
      grist.docApi.fetchTable("Animals").then((resp) => {
        results = resp.Result;
        date = resp.Date;
        target = resp.Target;
        // Define the trace for the chart
        const traceResult = {
          y: results,
          x: date,
          type: "bar",
        };
        const traceTarget = {
          y: target,
          x:date,
          type : "line",
        };

        const data = [traceResult,traceTarget]

        // Define the layout of the chart
        // Create the chart using Plotly.js
        Plotly.newPlot("chart-container", data);
      });});
  </script>
</body>

</html>
So I think I can now easily store information in Grist and use different plotting libraries to achieve customized chart rendering.
My question now would be from grist-plugin-api.js, is there a way to access the current table with the filtered data directly similar as in the view or do I have to implement it manually ?
I’ll copy a better one in a dedicated url, the one I am using now will whange since I am making tests.
Honestly this is a very bsic stuff aiming at unsderstnding few concepts…
But if you want you can just copy paste the code above in a file and serve this file (github, cloudlares,…) and point your custom-widget to this url…