I had spent some 30 minutes configuring an advanced chart and saving it.
Then I tried changing grid spacing and it froze. Only the widget froze. I still could use the browser. Changing pages, when returning to the page with the Advanced Chart wizard, it was still frozen. Changing documents, when returning to the document and page with the widget, it had reseted.
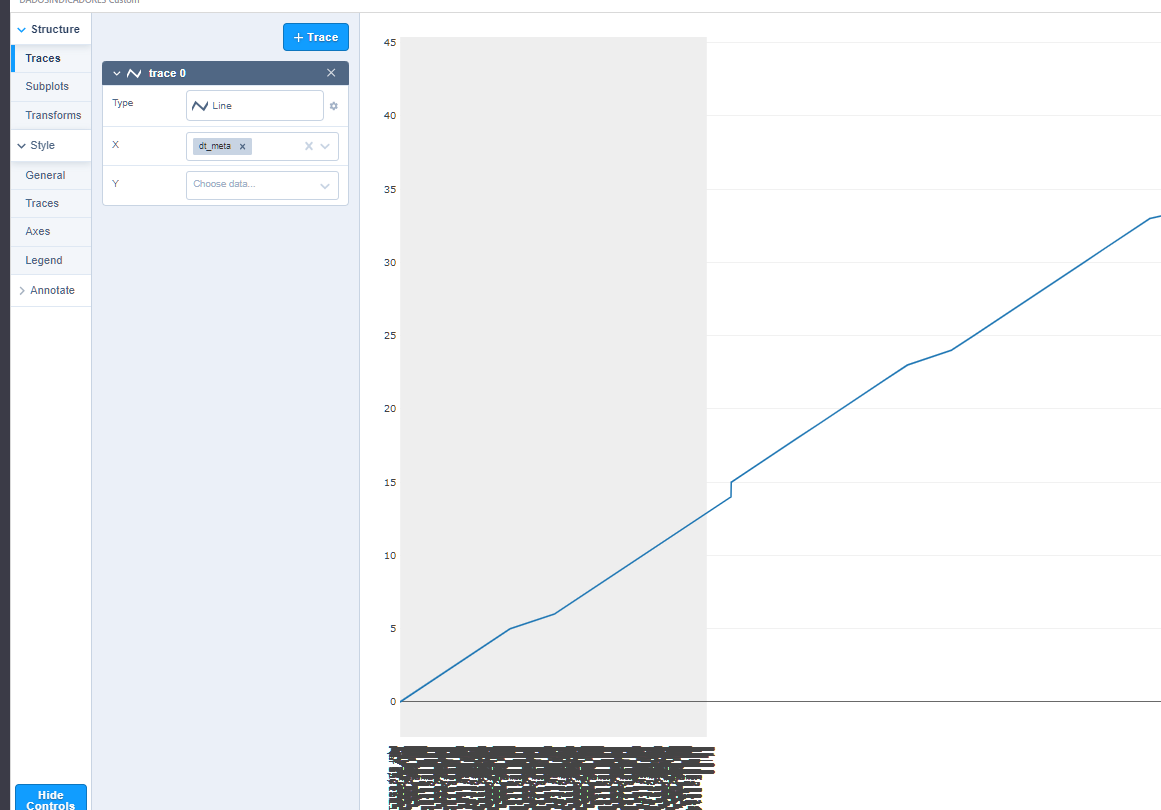
I made a new test now. I changed the gridlines and then added the first trace.
Look below the graphic. The gridlines created a solid block (they are too close together) and apparently, thousands of grid text below.
Ok… the problem is that I am using a list of KPIs on the left. Based on the KPI it shows the data on the bottom widged and an advanced chart of that data on the right.
Warning: NEVER use CUSTOM gridlines if you are using a dynamic graphic that can change quite a lot.
With custom gridlines, by default it will try to show one gridline for each integer, or to each 10 integers in the data. If the next data set has data going from 1000 to 1 million, it will try to draw thousands of gridlines… and it will basically freeze trying to draw them.
Changing all gridlines (x and Y) to automatic, and then increasing the Max Number of Lines solves the issue without overloading the chart rendering engine.