I tried unsuccessfully to do something similar before, but I’m hoping this one is easier.
What I am trying to achieve is the ability to filter from the top down by “Who”. There are multiple Who’s. I was hoping that selecting Who from table #1 would filter to only summary records in #2 with the selected Who. Then I can scroll through the various records by date for that Who in table #2. That would get me the details of the day on table #3.
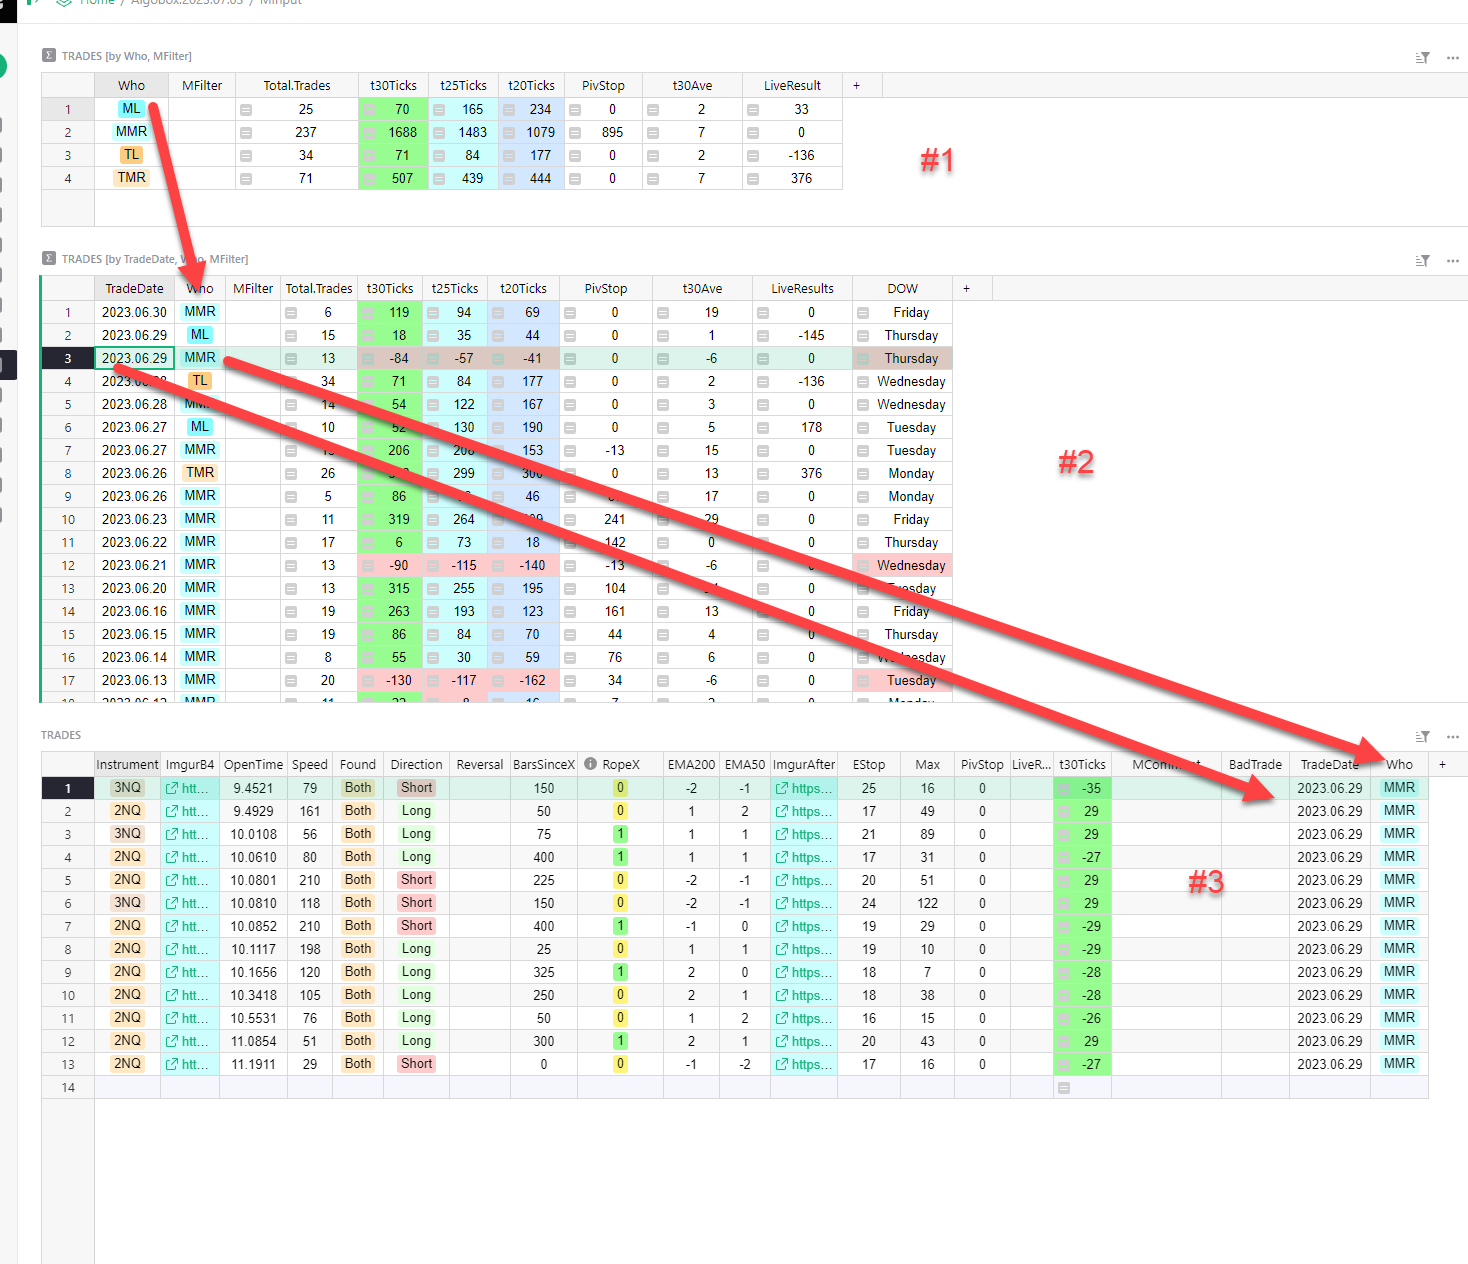
Below shows the cascade of my 3 tables. Table #1 and #2 are both summary tables of table #3, the Trades table
I have #3 set up so that when I select a record in #2, table #3 is filtered for that record only.
When I tried to make Table #2 a filtered view based on the record selected in #1, it wasn’t an option.
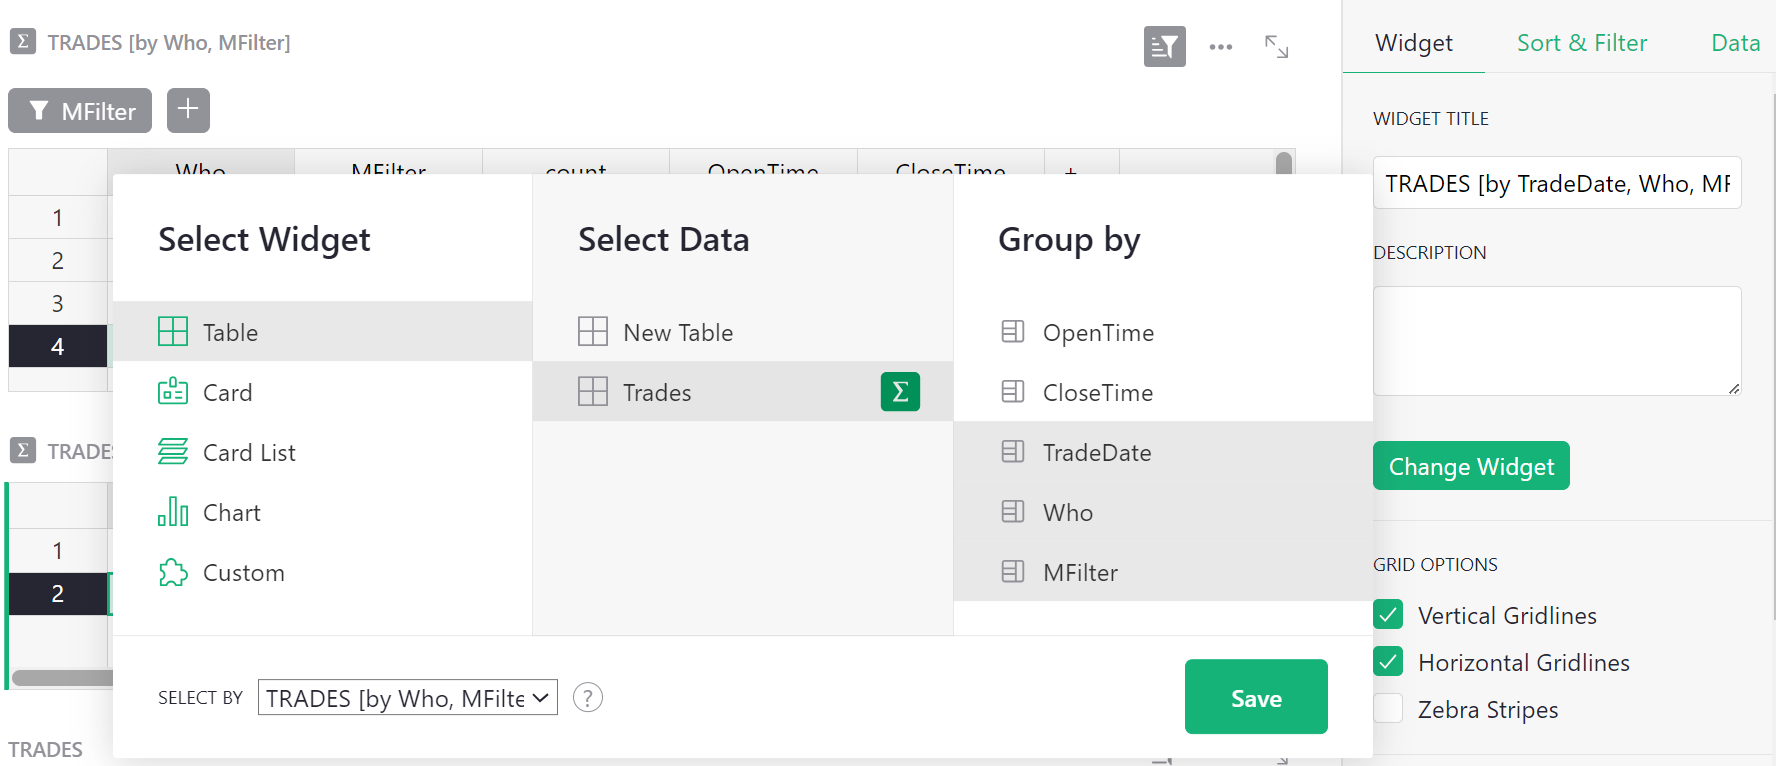
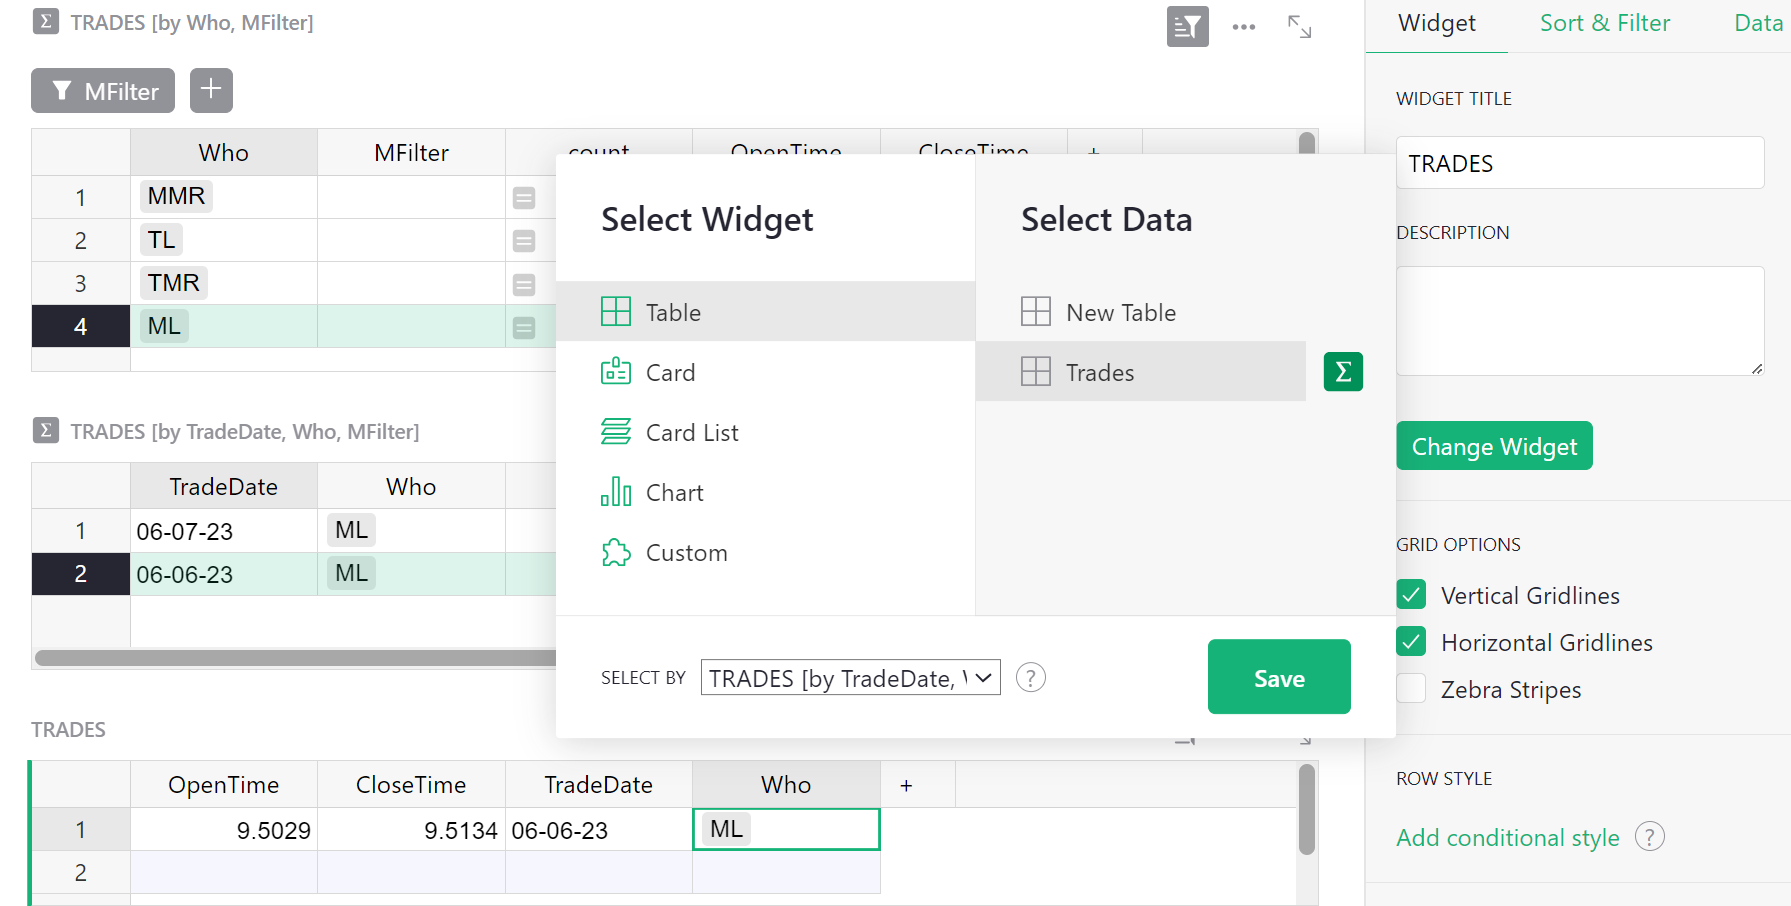
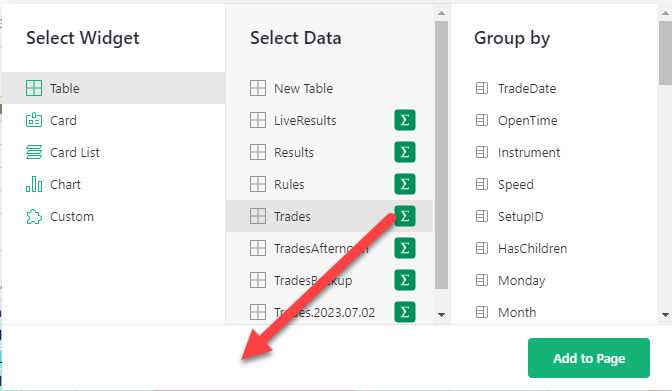
When I create a widget by selecting the Trades table in the Select Data view, I get the option for SELECT BY.
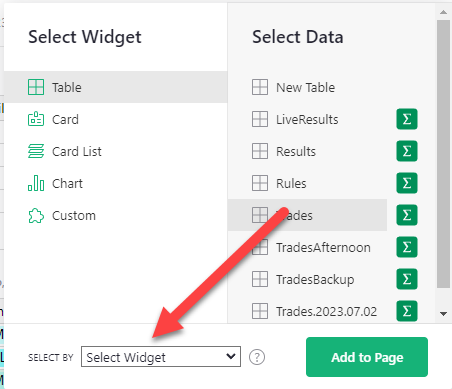
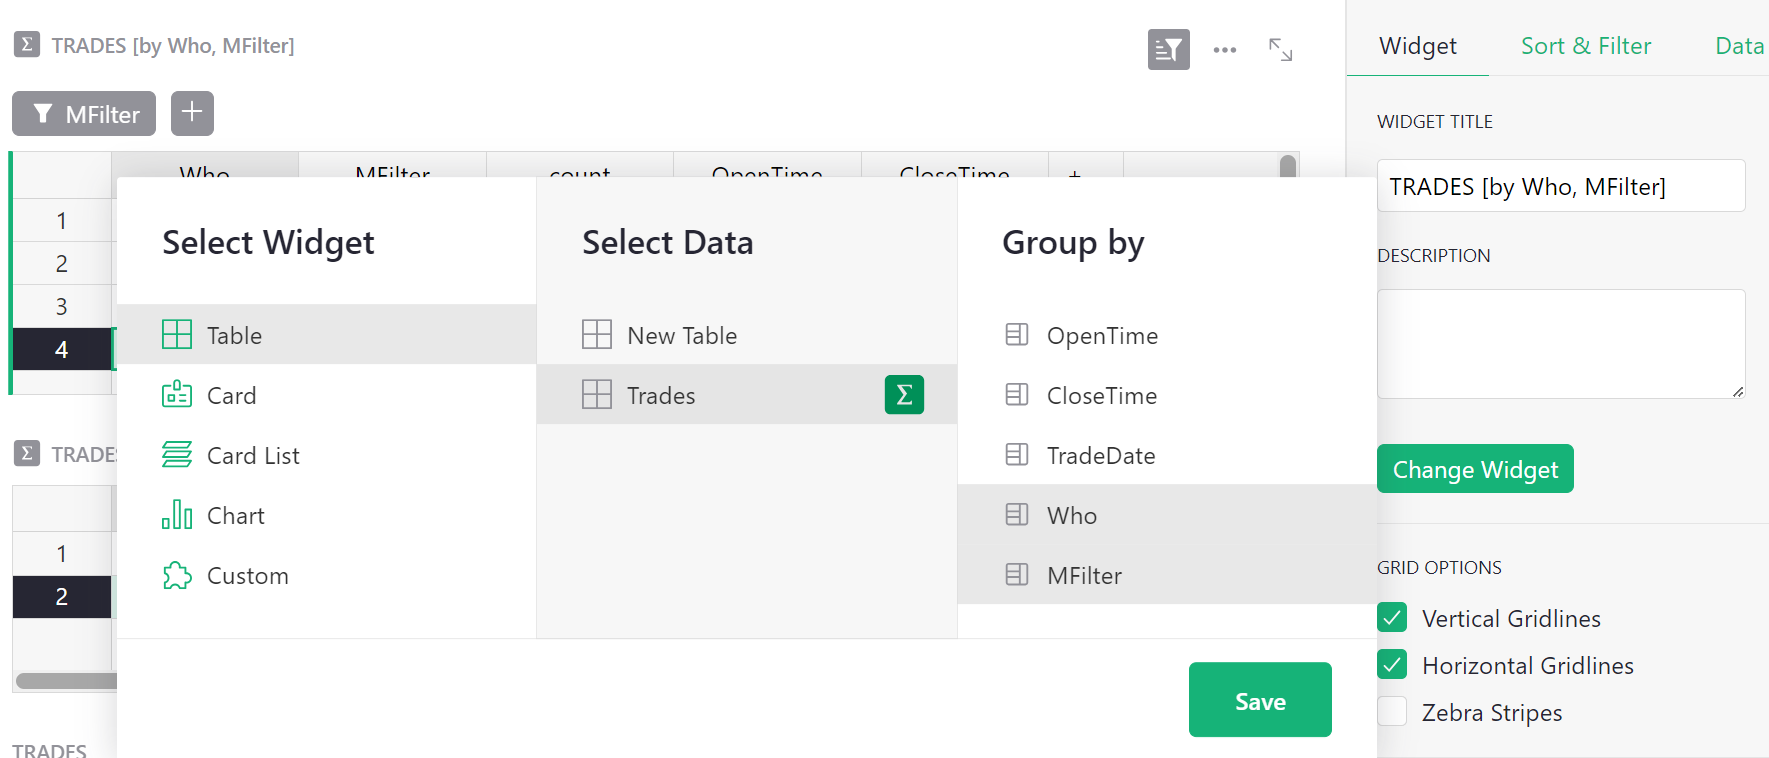
When I create a widget by selecting the summary, which I would like to have, I don’t get an option for SELECT BY.
I know I can manually filter table #2, but is there a way to have table #2 filtered automatically filtered by the record I select in table #1
thanks
mike
Hi Mike!
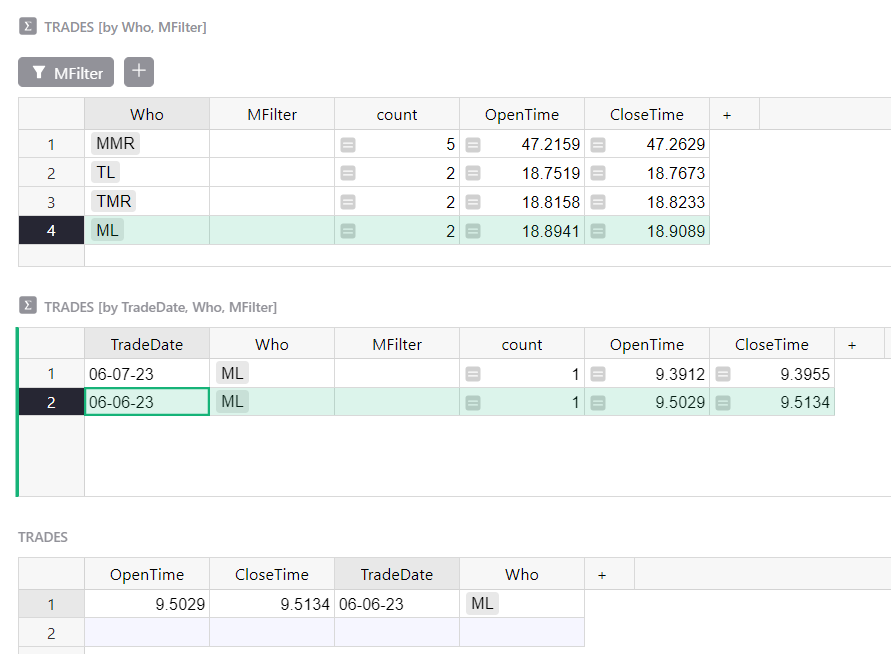
Yes, you can filter summary table #2 based on what record is selected in summary table #1. The key here is that they need to be grouped similarly. Because Summary Table #1 is grouped by Who and MFilter, Summary Table #2 must also be grouped by these two columns. In your example, summary table #2 also needed to be grouped by TradeDate. So as long as it has Who and MFilter in the Group By selections, then you can select by Summary Table #1.
I set up an example here: Community #2812 - Grist
First summary table is grouped by Who and MFilter and is filtered to only show records where MFilter is False.
Summary Table #2 is grouped by TradeDate, Who and MFilter and select by is Summary Table #1.
Table #3 is the Trades table and select by is Summary Table #2.
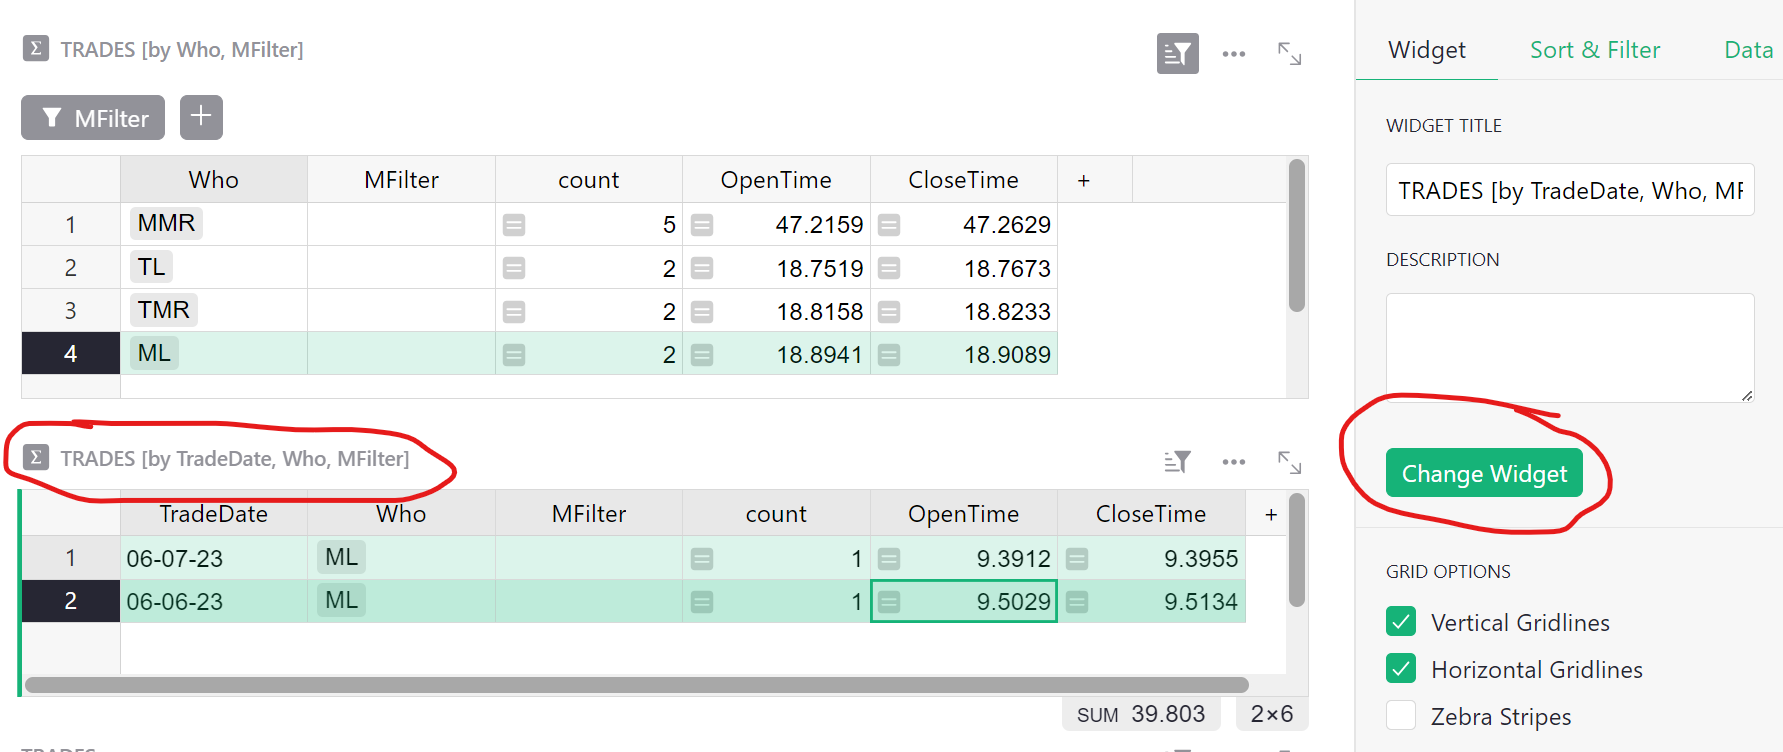
Just based on your screenshots, it seems everything is already set up correctly. So you can select Summary Table #2 then click the green ‘Change Widget’ button then update the ‘Select By’ option to select by summary table #1.
If you are still running into issues, please share your document with support@getgrist.com and I can take a closer look.
Thanks,
Natalie
1 Like
Thank you Natalie. That worked… I was sooo close
1 Like
Hi folks, based on the answer, I’m guessing there might not be a way to do what I’m trying to do.
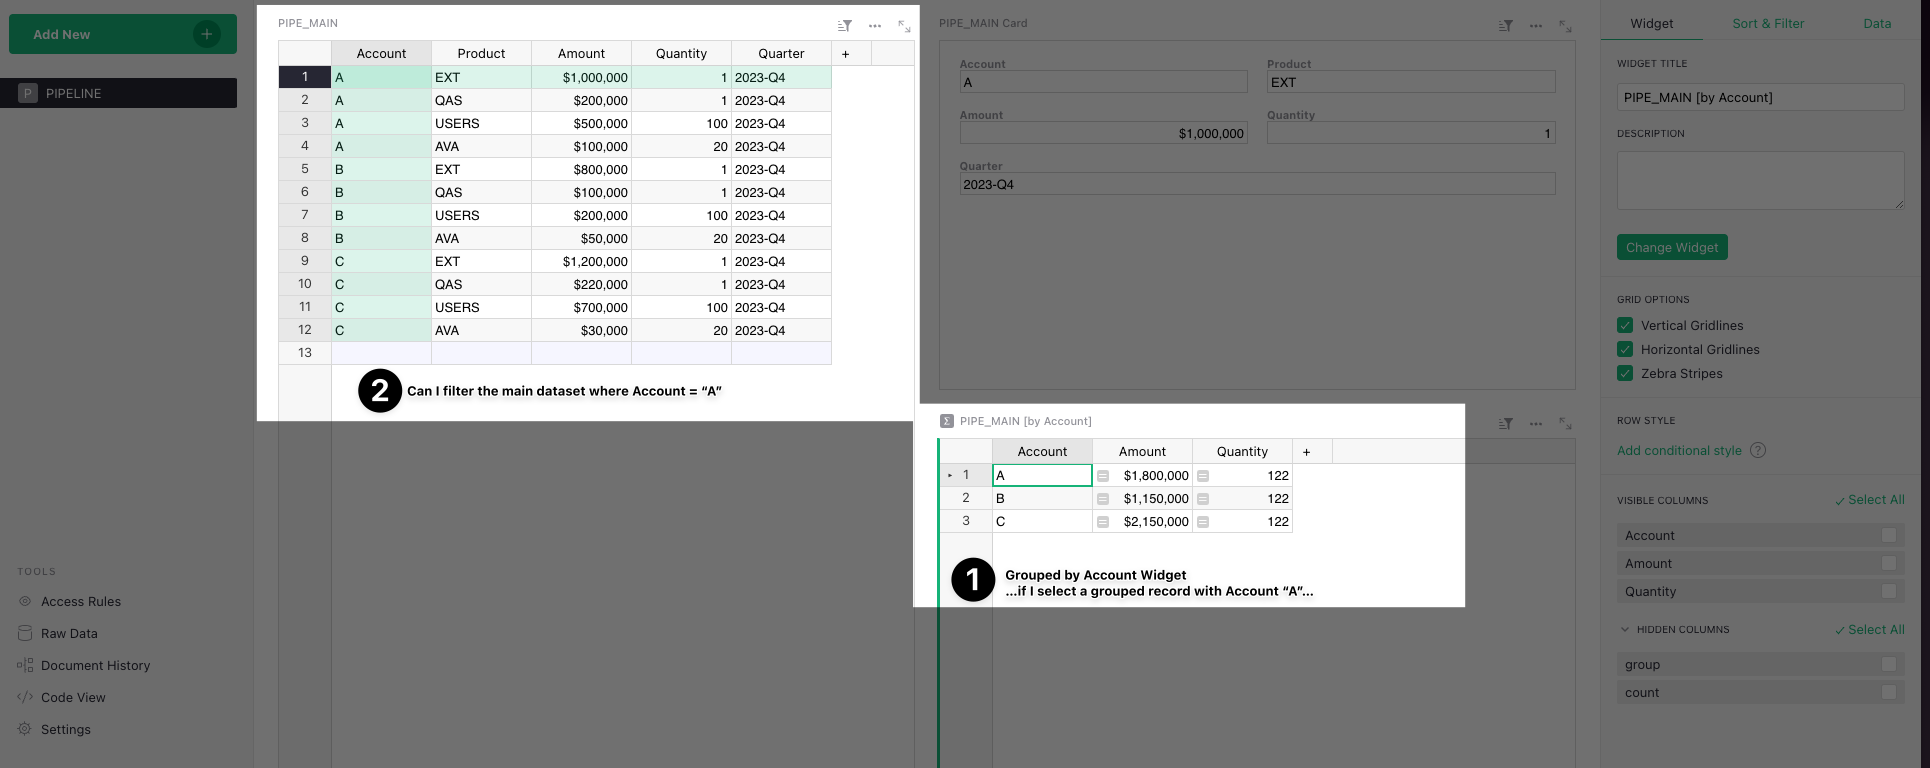
I have a main dataset of sales opportunities for various accounts, with multiple line items for products. I was trying to:
- Create a grouped widget by Account, with sum of total sales Amount, sorted descending to look at the largest opportunities.
- I want to click on a record in the grouped widget, and filter the main dataset by the account. In the real world, there might be more than one sales opportunity for the same account, and I might want to see all of them in one view to understand the relationship between the largest deal and smaller deals.