Hello all.
I have a table which contains data pulled on the first of each month. I’m trying to plot it with Month as the X-axis and a separate string value for the Split Series with a numeric value for the Series. However, when I set the X-axis to Month, it inserts days in between (i.e. Aug. 22, 27, 29) when I need it to simply display by Month (i.e. Aug, Sept, etc.). The Split Series string grouping seems to be working fine.
I’ve tried formatting the Month column and making a helper column with .strftime(‘%Y-%m’) in a different table widget, but it keeps inserting days between each month, as shown below:
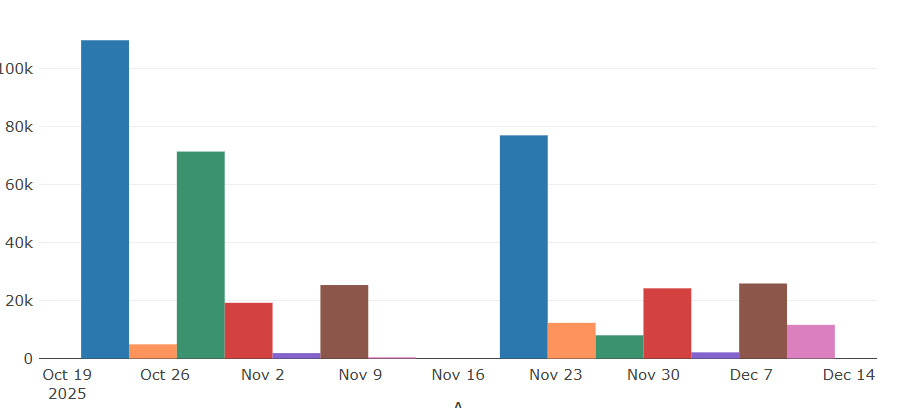
This happens regardless of if the table is linked to a table or not. I am filtering within the chart to make sure the dates are within a separately widget-specified range, but that range is accurately reflected. This example is looking from October to December 2025, but there shouldn’t be any day enumeration. The Month values at most are on the first of each month, and after formatting, I don’t see from where it would be pulling a day value.
Apologies if this is too basic. Thanks for y’all’s help and have a good week.