Hey guys,
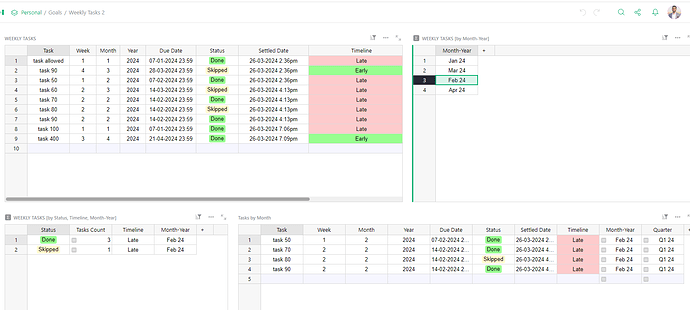
I’m new to Grist and trying to replicate a lot of what I do in Google spreadsheets. Here’s a screenshot of what I’m currently looking at.
This is a basic list of personal tasks. Top right I have months so I can use those to select data. Bottom left table is the problem. I want to see the number of late, early and on time tasks by month. That was straightforward, group by month and “timeline”. Then, use the top right table to select month and the data reflects correctly.
Now the issue is, I only want to see the number of “Done” tasks “Skipped” tasks in a given month. If I do group by “timeline” and “status”, that doesn’t really give me what I want.
What I want is a table that says something along the lines of:
Done: (number)
Skipped: (number)
Total: (number)
Late: (number)
Early: (number)
On Time: (number)
Total: (number)
Maybe spice it up with some “percentages” as well. In Google spreadsheets, I’d usually just create a new tab in the sheet and pull all of that data from the first sheet and format it the way I like. Having a bit of trouble doing that with Grist.
I know Grist was designed to be even more versatile then typical spreadsheets, so I’m sure I’m missing something here.
Would love some pointing in the right direction.
Thanks,
Youssef

