Hi there!
I created an example for you at the link below:
https://public.getgrist.com/8RRtrmsw6wNU/Community-1140/m/fork
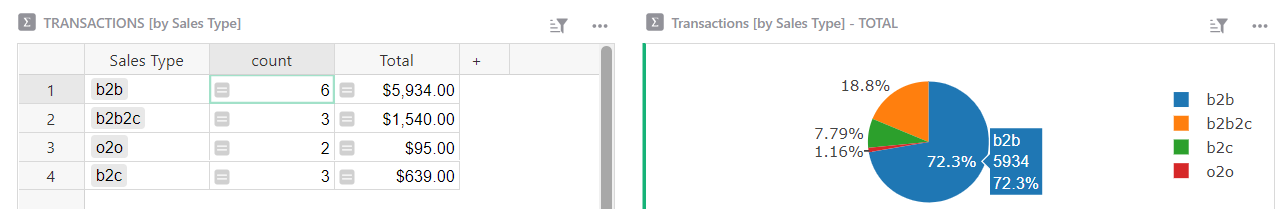
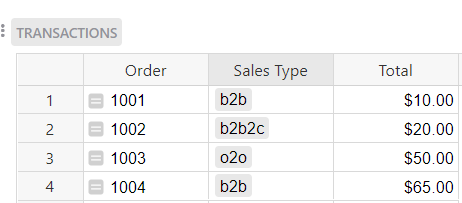
In the Transactions table, I have a list of orders, their sales type and the total for each order.
To the right of this table, I have a chart that shows the number of orders for each sales type.
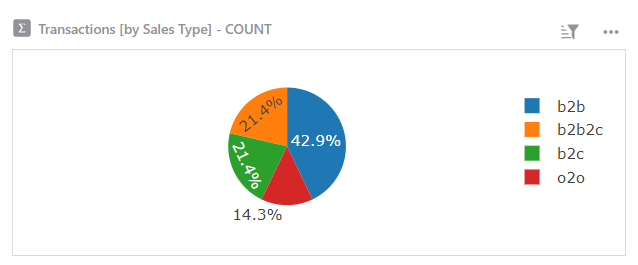
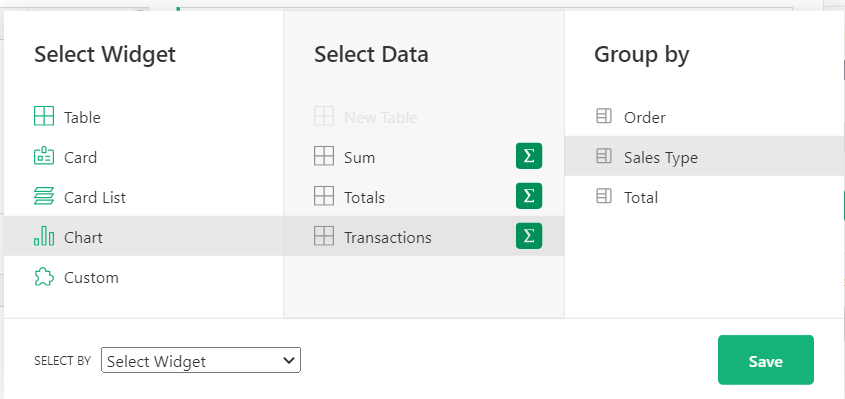
To create this chart, select the green Add New button then Add Widget to Page > Select Widget = Chart > Select Data = Transactions > Click the green Summation icon > Group By = Sales Type.
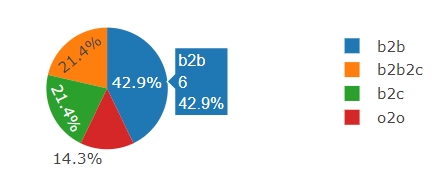
Now, we can see how many orders exist for each sales type. Below the Transactions table, I created a summary table, grouped by Sales Type. This is just the table representation of the chart we see in the upper right of the page. If you hover over each section of the “Transactions [by Sales Type] - COUNT” pie chart, you’ll see the count matches up to the “Transactions [by Sales Type]” summary table
I created a second chart that represents the total sales for each sales type.
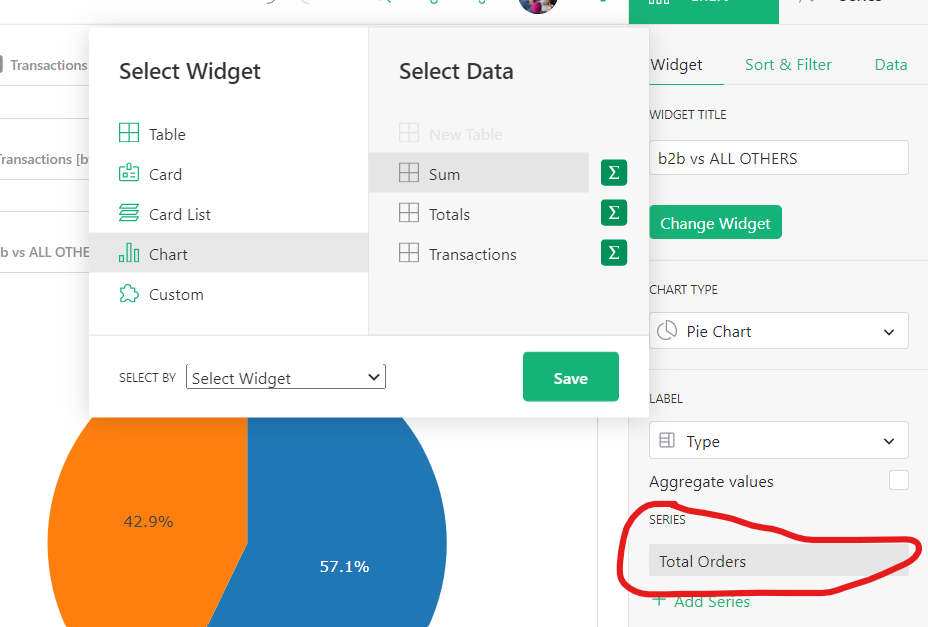
This is the same chart as our first but this time, we select ‘Total’ as our series, rather than ‘Count’. You can select your series by opening the chart configuration panel on the right-hand side of the screen, select the Widget tab then select the ‘Total’ series.
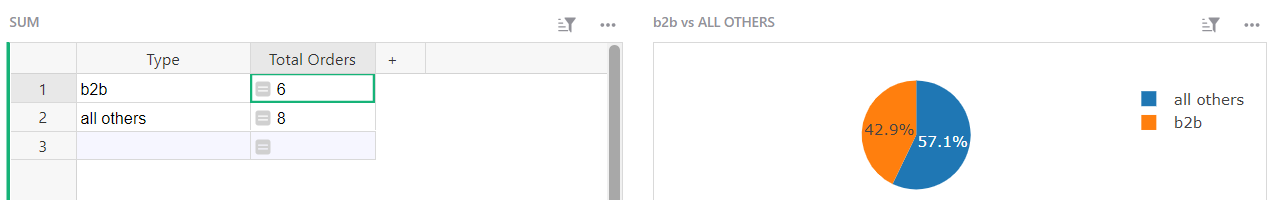
Now, to compare b2b sales type to ALL OTHERS, we need to create a helper table. That’s what the SUM table is at the bottom of the page. We have two columns, Type and Total Orders. Total Orders is a formula column that calculates the number of orders in the Transactions table for either b2b sales type or non-b2b sales type. The formula used here is:
all_types = Transactions.lookupRecords().Sales_Type
if $Type == "b2b":
  return sum(type == 'b2b' for type in all_types)
else:
  return sum(type != 'b2b' for type in all_types)
First, we use lookupRecords to find the Sales Type for each record in the Transactions table. This returns a list of Sales Types. We assign this list to our variable, all_types.
If the value in the Type column is ‘b2b’, the formula returns the number of times that b2b is listed as the Sales Type for all records in the Transactions table.
If the value in the Type column is anything else, the formula returns the number of times that b2b is not listed as the Sales Type for all records in the Transactions table, essentially counting the total of b2b2c, o2o and b2c records.
This last chart shows us the series Total Orders from the Sum table.
Let me know if you have any other questions!
Natalie