Hi everyone!
I’m excited to share a new functionality I’ve been working on for Grist - a Mind Map widget.
I wanted a way to visualize hierarchical data directly within my tables, so I migrated the logic from a popular Obsidian plugin.
Credit & Attribution: This is a migration of the custom plugin for Obsidian created by lynchjames.
-
Original Creator: lynchjames
-
Original Repository: https://github.com/lynchjames/obsidian-mind-map
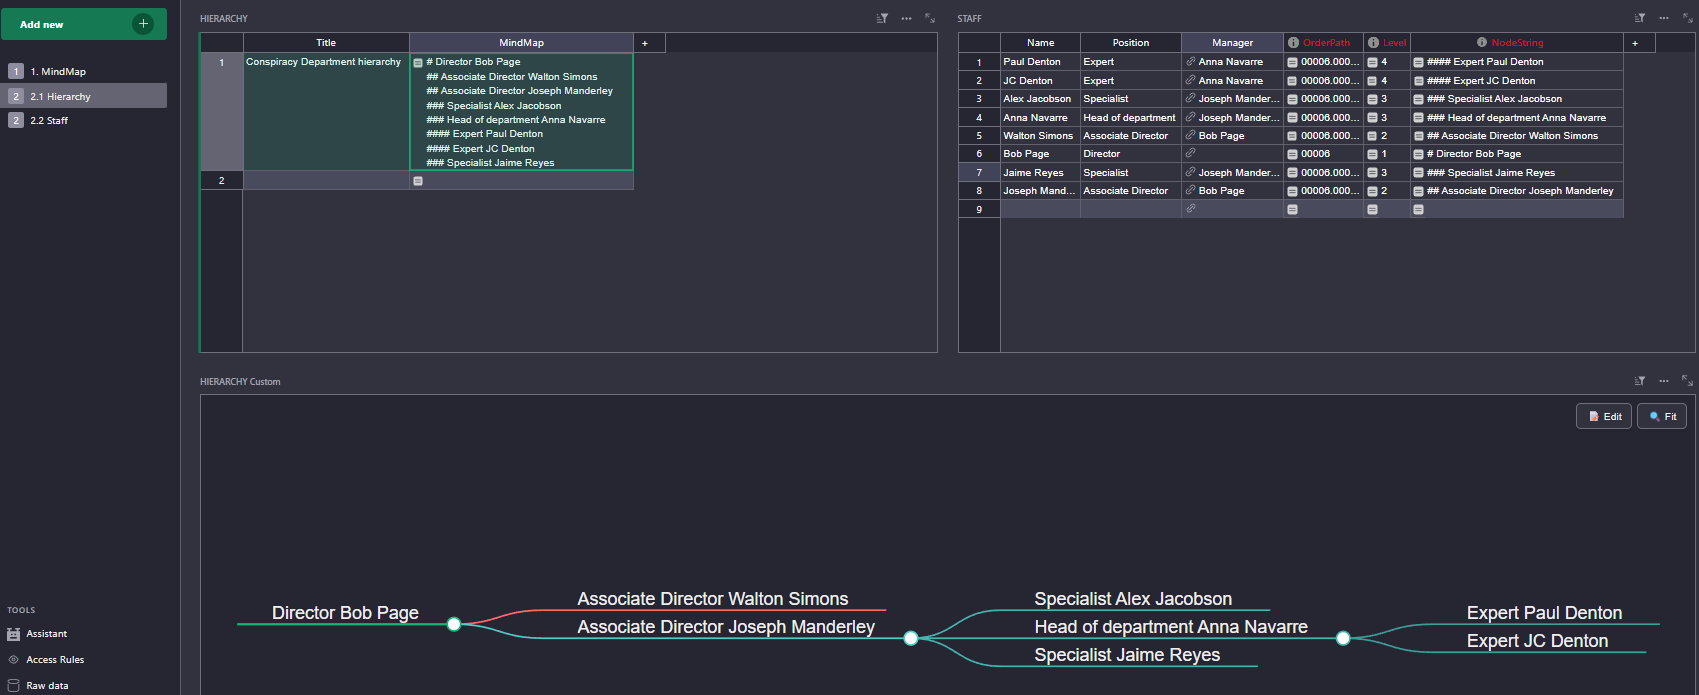
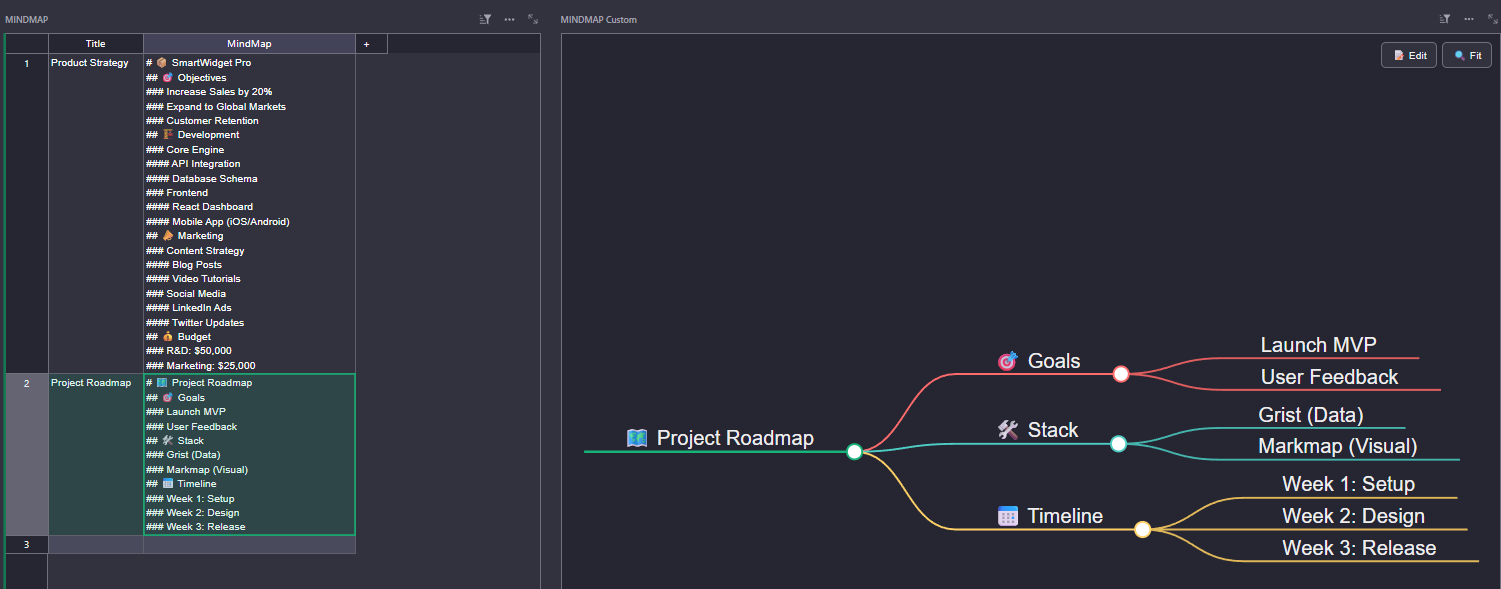
How it works: The widget takes a Markdown string from a Grist column and renders it as an interactive, zoomable mind map. It uses the Markmap library to render Markdown as a tree.
Example Input:
# 🗺️ Project Roadmap
## 🎯 Goals
### Launch MVP
### User Feedback
## 🛠️ Stack
### Grist (Data)
### Markmap (Visual)
## 📅 Timeline
### Week 1: Setup
### Week 2: Design
### Week 3: Release
Setup Instructions:
-
Add a Custom Widget to your Grist page.
-
Select Open Custom Widget Builder.
-
Paste the code into the HTML/JavaScript sections.
-
In the widget settings, map your Markdown column (MindMap) to the widget’s input.
-
Watch your data transform into a Mind Map!
![]() ACHTUNG: The column name should be “MindMap” - if you want something else, replace it in the HTML code.
ACHTUNG: The column name should be “MindMap” - if you want something else, replace it in the HTML code.
HTML code:
<!DOCTYPE html>
<html>
<head>
  <meta charset="UTF-8">
  <script src="https://docs.getgrist.com/grist-plugin-api.js"></script>
  <script src="https://cdn.jsdelivr.net/npm/markmap-autoloader@0.16.0"></script>
  <script src="https://cdn.jsdelivr.net/npm/d3@7"></script>

  <style>
    /* === Grist Theme Integration === */
    :root {
      --bg-color: var(--grist-theme-page-bg, #ffffff);
      --text-color: var(--grist-theme-text, #111111);
      --accent-color: var(--grist-theme-primary, #2196F3);
      --btn-bg: var(--grist-theme-widget-bg, #f0f0f0);
      --btn-text: var(--grist-theme-text, #333333);
      --btn-border: var(--grist-theme-widget-border, rgba(0,0,0,0.1));
    }

    html, body {
      margin: 0; padding: 0; height: 100vh; overflow: hidden;
      background-color: var(--bg-color);
      color: var(--text-color);
      font-family: sans-serif;
      transition: background-color 0.2s;
    }

    #mindmap { width: 100vw; height: 100vh; }
    svg { width: 100%; height: 100%; }

    /* UI Controls */
    .controls {
      position: absolute; top: 10px; right: 10px;
      display: flex; gap: 6px; z-index: 10;
    }

    button {
      background: var(--btn-bg);
      color: var(--btn-text);
      border: 1px solid var(--btn-border);
      padding: 6px 12px;
      border-radius: 6px;
      cursor: pointer;
      font-size: 13px;
      box-shadow: 0 2px 4px rgba(0,0,0,0.1);
      transition: filter 0.2s;
    }
    button:hover { filter: brightness(0.9); }

    /* Markdown Editor Overlay */
    #editor-container {
      position: absolute; inset: 0;
      background: var(--bg-color);
      display: none; flex-direction: column; z-index: 20;
    }

    textarea {
      flex-grow: 1; background: var(--bg-color); color: var(--text-color);
      padding: 20px; border: none; font-family: monospace;
      font-size: 16px; outline: none; resize: none;
    }

    .editor-footer {
      padding: 10px; display: flex; justify-content: flex-end; gap: 10px;
      border-top: 1px solid var(--btn-border);
    }

    /* Node Label Styling */
    .markmap-node div {
      color: var(--text-color) !important;
      font-weight: 500;
    }
  </style>
</head>
<body>

  <div class="controls">
    <button onclick="toggleEditor()">📝 Edit</button>
    <button onclick="zoomFit()">🔍 Fit</button>
  </div>

  <div id="editor-container">
    <textarea id="markdown-input" placeholder="Enter Markdown here..."></textarea>
    <div class="editor-footer">
      <button style="background:#e57373;color:white;border:none" onclick="toggleEditor()">Cancel</button>
      <button style="background:#4CAF50;color:white;border:none" onclick="saveAndClose()">💾 Save & Close</button>
    </div>
  </div>

  <div id="mindmap"><svg id="markmap-svg"></svg></div>

  <script>
    let mm = null;
    let lastContent = "";
    let currentRecordId = null;

    // Obsidian-inspired color palette for main branches
    const obsidianColorPalette = [
      '#FF6B6B', '#4ECDC4', '#FFD166', '#06D6A0',
      '#118AB2', '#073B4C', '#EF476F', '#7209B7',
      '#F15BB5', '#00BBF9', '#00F5D4', '#FF9E00'
    ];

    // Initialize Grist API
    grist.ready({
      requiredAccess: 'full',
      columns: [{ name: "MindMap", type: "Text", title: "Markdown Data" }]
    });

    // Re-render map when Grist theme options change
    grist.onOptions(() => {
      if (lastContent) renderMindMap(lastContent);
    });

    // Load data from selected record
    grist.onRecord((record) => {
      currentRecordId = record.id;
      const content = record.MindMap || "";
      if (content !== lastContent) {
        lastContent = content;
        renderMindMap(content);
      }
    });

    // Get primary accent color from Grist theme
    function getGristAccent() {
      return getComputedStyle(document.documentElement)
        .getPropertyValue('--accent-color').trim() || '#2196F3';
    }

    // Calculate node colors based on depth and branch index
    function getNodeColor(node, depth = 0, branchIndex = 0) {
      // Root node uses Grist accent color
      if (depth === 0) return getGristAccent();

      const baseColor = obsidianColorPalette[branchIndex % obsidianColorPalette.length];
      // Main branches (depth 1) use base palette colors
      if (depth === 1) return baseColor;

      // Sub-branches are darkened progressively based on depth
      const hex = baseColor.replace('#', '');
      const r = parseInt(hex.substr(0, 2), 16);
      const g = parseInt(hex.substr(2, 2), 16);
      const b = parseInt(hex.substr(4, 2), 16);

      const darkenFactor = Math.pow(0.88, depth - 1);
      const newR = Math.max(0, Math.min(255, Math.floor(r * darkenFactor)));
      const newG = Math.max(0, Math.min(255, Math.floor(g * darkenFactor)));
      const newB = Math.max(0, Math.min(255, Math.floor(b * darkenFactor)));

      return `rgb(${newR}, ${newG}, ${newB})`;
    }

    // Recursively process tree data to assign colors
    function processTree(node, depth = 0, branchIndex = 0) {
      if (!node) return null; // Safety check for empty nodes

      node._color = getNodeColor(node, depth, branchIndex);

      if (node.children && Array.isArray(node.children)) {
        node.children.forEach((child, idx) => {
          // Pass new branch index for depth 1, otherwise inherit from parent
          const newBranchIndex = (depth === 0) ? idx : branchIndex;
          processTree(child, depth + 1, newBranchIndex);
        });
      }
      return node;
    }

    // Main rendering function
    function renderMindMap(markdown) {
      const svg = document.getElementById('markmap-svg');

      // Handle empty or invalid input
      if (!markdown || typeof markdown !== 'string' || markdown.trim() === '') {
        svg.innerHTML = '';
        if (mm) mm.setData({ content: '', children: [] });
        return;
      }

      try {
        const { Markmap, Transformer } = window.markmap;
        const transformer = new Transformer();

        // Transform Markdown to data structure
        const result = transformer.transform(markdown);
        const root = result.root;

        if (root) {
          processTree(root);

          const options = {
            autoFit: true,
            paddingX: 30,
            duration: 300,
            // Apply assigned colors to lines and nodes
            color: (node) => node._color || getGristAccent()
          };

          if (!mm) {
            mm = Markmap.create(svg, options, root);
          } else {
            mm.setData(root);
            mm.setOptions(options);
            mm.fit();
          }
        }
      } catch (e) {
        console.error("Markmap Render Error:", e);
        svg.innerHTML = `<text x="20" y="40" fill="red" font-family="monospace">Markdown Error: ${e.message}</text>`;
      }
    }

    // Show/Hide Markdown editor
    function toggleEditor() {
      const editor = document.getElementById('editor-container');
      if (editor.style.display !== 'flex') {
        document.getElementById('markdown-input').value = lastContent;
        editor.style.display = 'flex';
        document.getElementById('markdown-input').focus();
      } else {
        editor.style.display = 'none';
      }
    }

    // Save changes back to Grist
    async function saveAndClose() {
      const newContent = document.getElementById('markdown-input').value;
      if (!currentRecordId) return;
      try {
        const table = await grist.getTable();
        const tableId = await table.getTableId();
        await grist.docApi.applyUserActions([
          ["UpdateRecord", tableId, currentRecordId, { MindMap: newContent }]
        ]);
        lastContent = newContent;
        renderMindMap(newContent);
        toggleEditor();
      } catch (e) { alert("Save Error: " + e.message); }
    }

    // Utility: Fit map to container
    function zoomFit() { if (mm) mm.fit(); }

    // Event Listeners for window lifecycle
    window.addEventListener('resize', () => mm && mm.fit());
    window.addEventListener('beforeunload', () => mm && mm.destroy());
  </script>
</body>
</html>
It’s still in a “port” state, but it’s fully functional within the Grist Custom Widget ecosystem. I’d love to hear your thoughts or if anyone wants to help refine the data-mapping part!