Hi all,
I worked on custom widget for a personal project of mine, thought it could be of interest for others.
I put the code here:
And a dumb example there: https://docs.getgrist.com/u5UZbdDZCXKY/Restaurant-Inventory-w-graph?utm_id=share-doc
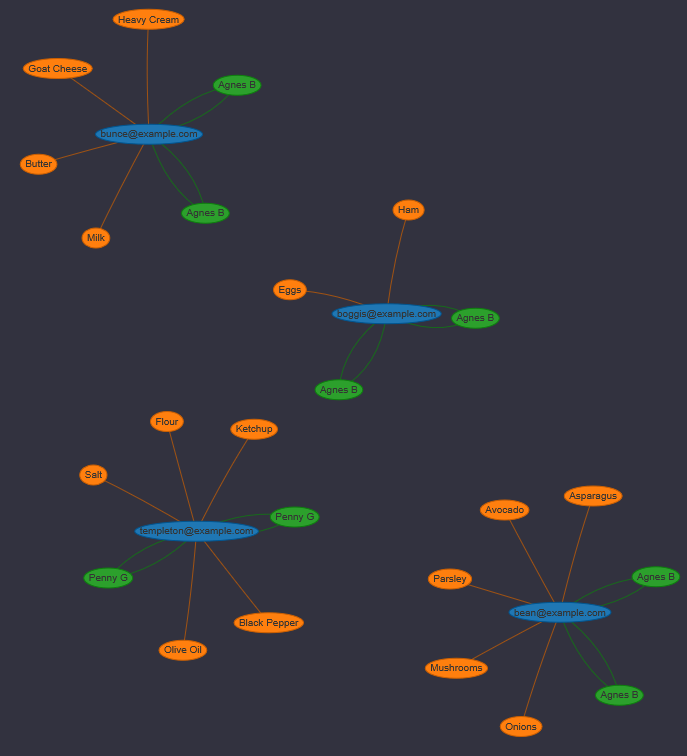
It creates a graph from linked nodes. For now it works with a three column table: the first column contains names of tables. Each record in those tables becomes a node in the graph. The second column refers to a text column in the table that will serve as labels for the nodes. The third column is for a reference column. It is used to create the edges in the graph.
Use the dropdown menus to add nodes and refs, and click “update graph” to see the created graph.