I’m trying to create a formula using lookupRecords and I’m just not getting the syntax. I don’t feel like what I’m doing is that complicated, but I haven’t been able to reverse engineer what I want from the many examples I’ve seen.
I have 2 simple tables. Shipped (shipped to my warehouse) and Sold (sold from the warehouse). I have 2 products that vary by color (Black, White)
Shipped table has columns: Date |Color | Quantity. To keep it simple each shipment is always just 1 color per row. ex: for shipped. I make 2 rows for the same day if more than 1 color shipped
03/10/2023 | White | 20
03/10/2023 | Black | 15
Sold table has the same columns as Shipped and I add data like shipped if selling more than 1 color on a particular day
03/12/2023 | Black | 2
03/12/2023 | White | 3
03/15/2023 | Black | 1
I can make summary tables of each that give how many I’ve sold and shipped of each color, but I want to create another table that does this without summary tables and does basic calculations on the data from 2 different tables to give me my current inventory of each color.
I would like to create a third table or card (not sure what to use) where I just collect the total number of White units shipped (put it in Column A) Total Number of Black units shipped (put it in Column B), total Number of White units Sold, (put it in column C) and total Number of Black Units sold (Put it in Column D). I should be able to then add a couple of formula columns where I subtract Column C from A to give me my current inventory of White units and another Subtracting D from B for current inventory of Black units.
Knowing how to do this would allow me to us my data in so many ways. Any help is greatly appreciated.
I’m not sure if this is the best option (someone else might chime in with a better solution), but you can add a new “Empty Table” and set up 4 formula columns, like you suggested.
Column A - White Units Shipped
units = Shipped.lookupRecords(Color='White')
return sum(units.Quantity)
Column B - Black Units Shipped
units = Shipped.lookupRecords(Color='Black')
return sum(units.Quantity)
Column C - White Units Sold
units = Sold.lookupRecords(Color='White')
return sum(units.Quantity)
Column D - Black Units Sold
units = Sold.lookupRecords(Color='Black')
return sum(units.Quantity)
Then it would be easy to add a Current White Inventory column with formula $C-$A and a Current Black Inventory column with formula $D-$B.
I would recommend adding a simple “Row Name” column at the beginning of your sheet, just so you can easily get the first (and only) row into the table. You can put any value you want into it.
(Because this table will only have 1 row, it makes me wonder if it’s the best design, but it should work well enough to get you started)
Why don’t you want to use a Summary Table? You could combine the values from multiple tables in the table using similar formulas. If you “Group By” the “Color” column, then you’ll get one row for White and one row for Black, which seems like a better design.
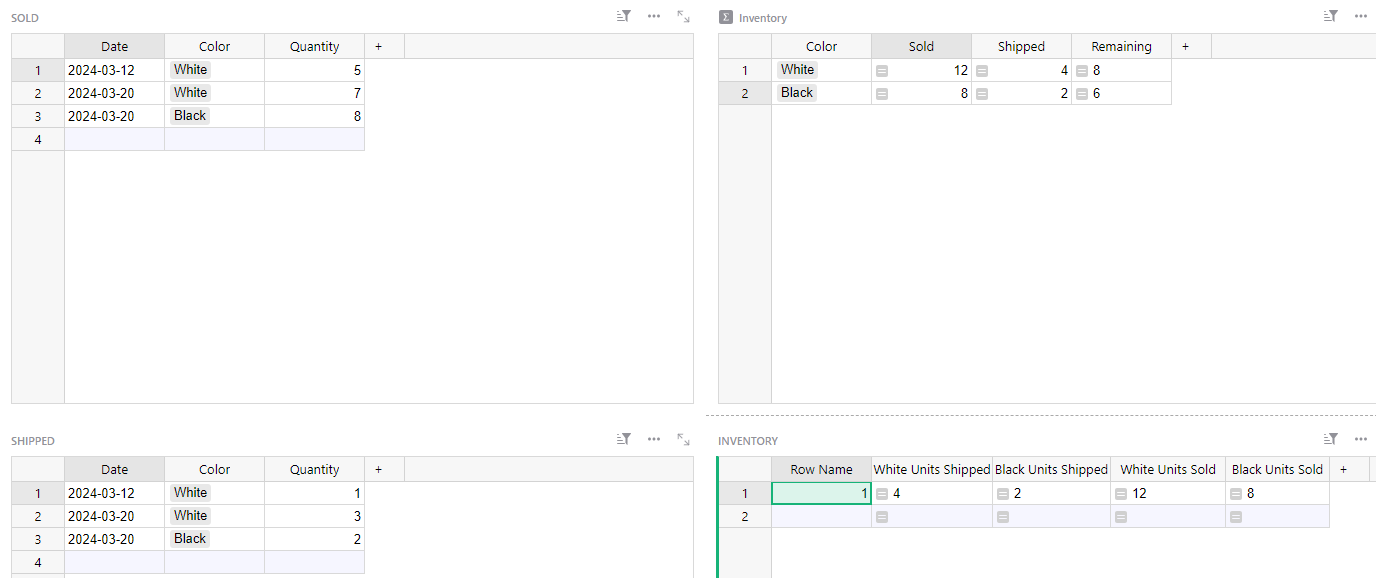
The left tables show your data tables. The top right is the Summary Table grouping by “Color” (the specific data table you select isn’t important, so long as both tables have the same “Color” options)
The bottom right is the non-summary table you suggested (which is what I proposed in my first post). I think the Summary Table option is better.
Here are the formulas for the Summary Table columns
Thanks!! This worked perfectly and so did the Summary Table example you gave. I’ll end up using both. There’s a lot more fields than what I was showing where I want to pull records and use them in different tables. This got me past that hurdle. Thanks again!!