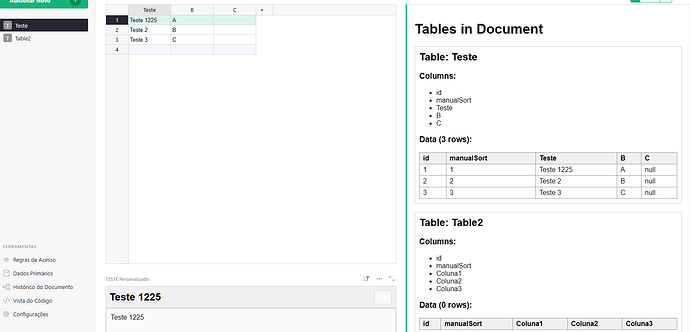
hi Sylvain… my code above was for the Widget Builder widget.
It seems that unlike Custom Widgets, the Widget Builder absolutely CAN´T retrieve data from extra tables… I think because it’s like a sandbox, it can´t access the Grist Plugin API.
What some Custom Plugins, like the Invoice plugin do, and can be used by the widget creator, is to have a formula in a cell that retrieves ALL DATA (or filtered data) from all references to a row.
Then you access that data, since it’s in the row of the table you are already connected to.
like this
# Step 1: Fetch all necessary data
sessoes = list(Sessoes.all)
pdca_records = PDCA.lookupRecords(EmpresaRef=$id)
resultados = Resultados.lookupRecords(RefEmpresa=$id)

# Step 2: Create a summarized structure
summary = {
    "sessoes": [{"id": sessao.id, "nome": sessao.Sessao_NomeSessao} for sessao in sessoes],
    "pdca": [{"id": record.id, "nota": record.Nota_da_Pratica} for record in pdca_records],
    "resultados": [{"id": resultado.id, "pontuacao": resultado.PONTUACAO} for resultado in resultados],
}

# Step 3: Return as JSON string
import json
return json.dumps(summary)
which returns
{“sessoes”: [{“id”: 1, “nome”: “PENSAMENTO SIST\u00caMICO”}, {“id”: 2, “nome”: “COMPROMISSO COM AS PARTES INTERESSADAS”}, {“id”: 3, “nome”: “APRENDIZADO ORGANIZACIONAL E INOVA\u00c7\u00c3O”}, {“id”: 4, “nome”: “ADAPTABILIDADE”}, {“id”: 5, “nome”: “LIDERAN\u00c7A TRANSFORMADORA”}, {“id”: 6, “nome”: “DESENVOLVIMENTO SUSTENT\u00c1VEL”}, {“id”: 7, “nome”: “ORIENTA\u00c7\u00c3O POR PROCESSOS”}], “pdca”: [{“id”: 1, “nota”: 81.25}, {“id”: 2, “nota”: 75.0}, {“id”: 3, “nota”: 68.75}, {“id”: 4, “nota”: 0.0}, {“id”: 5, “nota”: 56.25}, {“id”: 6, “nota”: 0.0}, {“id”: 7, “nota”: 0.0}, {“id”: 8, “nota”: 50.0}, {“id”: 9, “nota”: 0.0}, {“id”: 10, “nota”: 56.25}, {“id”: 11, “nota”: 0.0}, {“id”: 12, “nota”: 50.0}, {“id”: 13, “nota”: 62.5}, {“id”: 14, “nota”: 0.0}, {“id”: 15, “nota”: 0.0}, {“id”: 16, “nota”: 0.0}, {“id”: 17, “nota”: 0.0}, {“id”: 18, “nota”: 0.0}, {“id”: 19, “nota”: 0.0}, {“id”: 20, “nota”: 0.0}, {“id”: 21, “nota”: 0.0}, {“id”: 22, “nota”: 0.0}, {“id”: 23, “nota”: 0.0}, {“id”: 24, “nota”: 0.0}, {“id”: 25, “nota”: 0.0}, {“id”: 26, “nota”: 0.0}, {“id”: 27, “nota”: 0.0}, {“id”: 28, “nota”: 0.0}, {“id”: 29, “nota”: 0.0}, {“id”: 30, “nota”: 0.0}, {“id”: 31, “nota”: 0.0}, {“id”: 32, “nota”: 0.0}, {“id”: 33, “nota”: 0.0}, {“id”: 34, “nota”: 0.0}, {“id”: 35, “nota”: 18.75}, {“id”: 36, “nota”: 0.0}, {“id”: 37, “nota”: 0.0}, {“id”: 38, “nota”: 18.75}, {“id”: 39, “nota”: 0.0}, {“id”: 40, “nota”: 0.0}], “resultados”: [{“id”: 1, “pontuacao”: 80}, {“id”: 2, “pontuacao”: 80}, {“id”: 3, “pontuacao”: 60}, {“id”: 4, “pontuacao”: 40}, {“id”: 5, “pontuacao”: 0}, {“id”: 6, “pontuacao”: 0}, {“id”: 7, “pontuacao”: 0}, {“id”: 8, “pontuacao”: 0}, {“id”: 9, “pontuacao”: 0}, {“id”: 10, “pontuacao”: 0}, {“id”: 11, “pontuacao”: 0}, {“id”: 12, “pontuacao”: 0}, {“id”: 13, “pontuacao”: 0}, {“id”: 14, “pontuacao”: 0}, {“id”: 15, “pontuacao”: 0}, {“id”: 16, “pontuacao”: 0}, {“id”: 17, “pontuacao”: 0}, {“id”: 18, “pontuacao”: 0}, {“id”: 19, “pontuacao”: 0}, {“id”: 20, “pontuacao”: 0}, {“id”: 21, “pontuacao”: 0}, {“id”: 22, “pontuacao”: 0}]}
