Hi.
Pretty much in the title.
Is there any way to group by one field, but filter the data by a field that is not grouping the data ?
Use case:
Let’s have a table: TRANSACTIONS has fields like Category, Description, Date and Amount. Also a calculated field for storing only the month. All good now.
Desired Outcome: I’d like a widget (another table for now) that groups data by month, but filters by Category. So that each column is a single month, but I only want data in gifts given and gifts received category.
Issue:
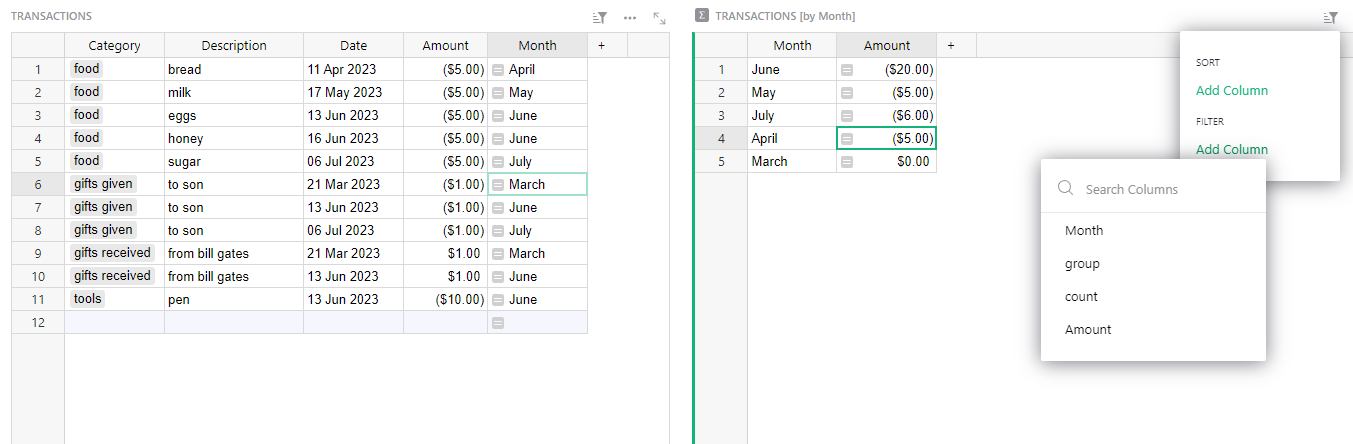
Try #1: After grouping by month, filtering by Category is not possible.
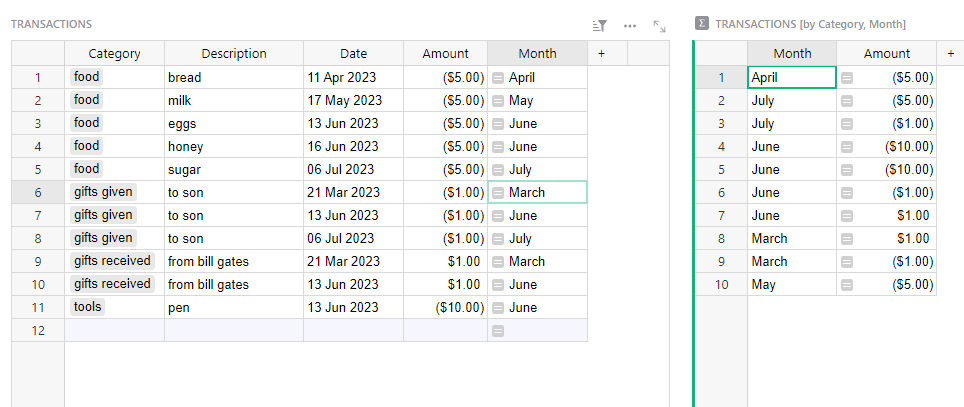
When using ‘Group By’, it’ll take all unique combinations and create a row for each. If you group by Month and Category then March > Gifts Given is its own category as is March > Gifts Received. This is why you are getting multiple rows for a single month.
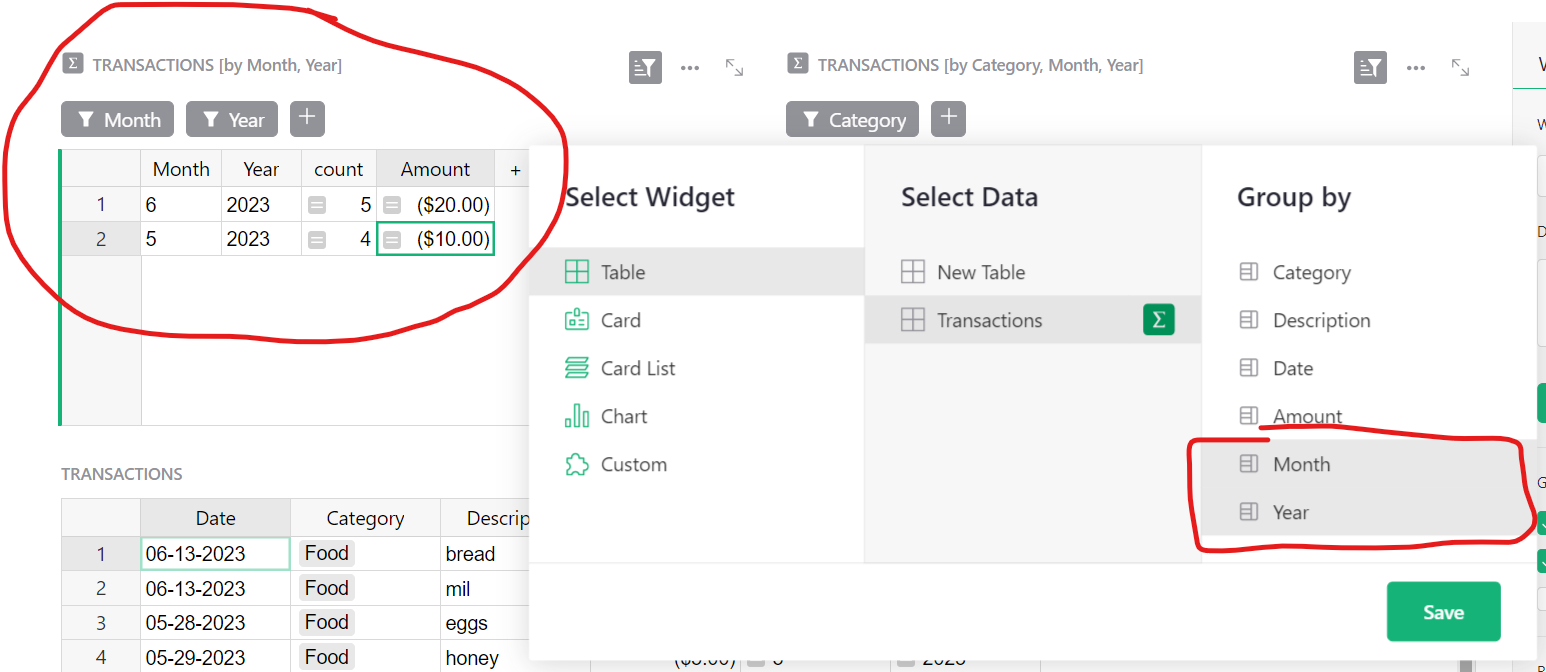
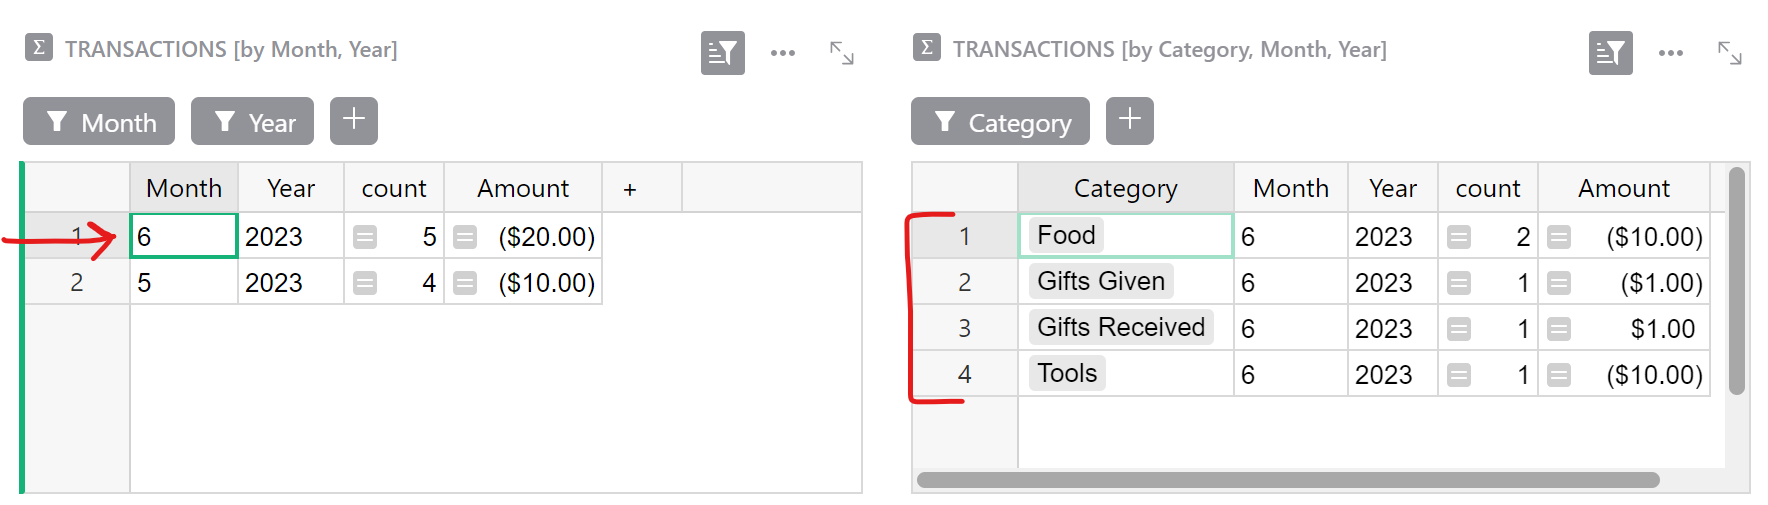
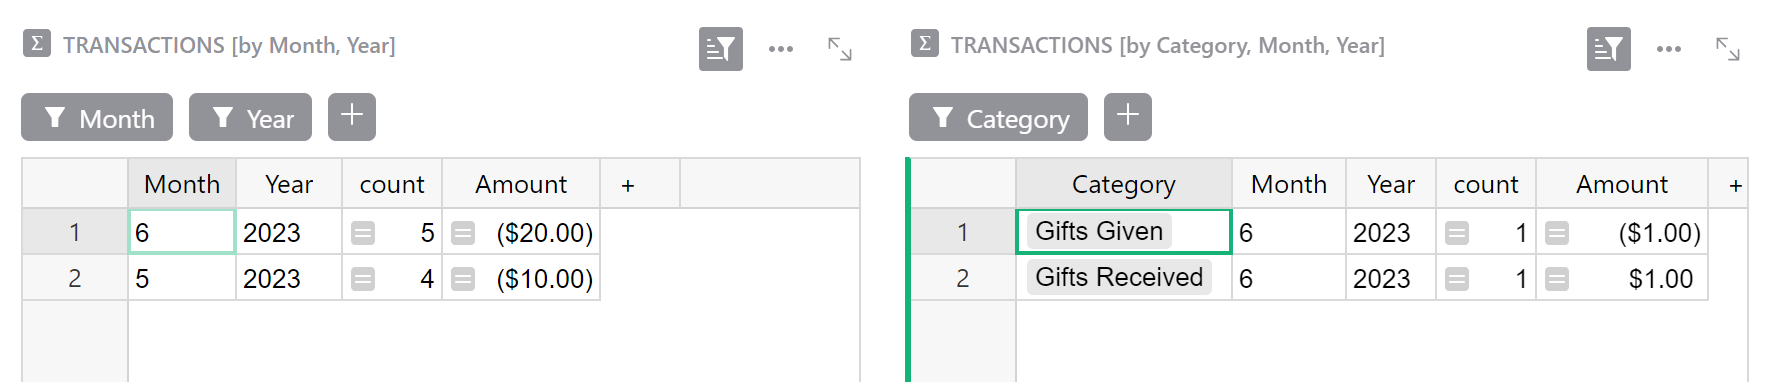
The best way to do this is using two summary tables. The first summary table would be grouped by Month. Then, add a second summary table to the page, grouped by Month and Category and select by the first summary table.
I also have it grouped by Year - this is so the summary table separates data from March 2021 from March 2022 for example. Otherwise, it’ll group all of these March transactions into a single one. If you’re using strftime(), you could modify your existing Month column to also include year by adding the code %Y into your string format.
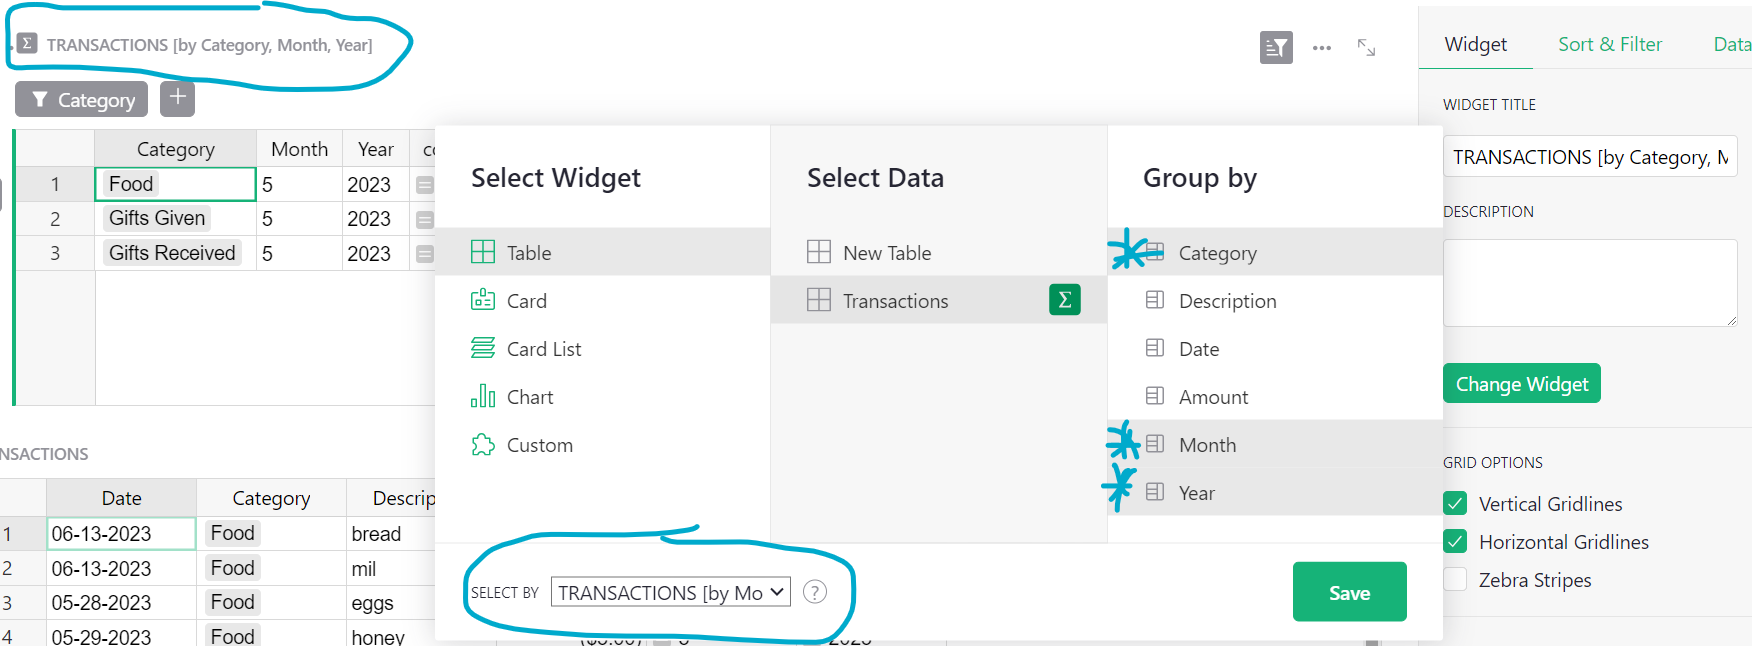
The second summary table is grouped by Month, Year and Category. Because we already have the first summary table grouped by Month and Year, we can use this table as our ‘Select By’ table.
Thanks for your effort, but it is not quite what I was looking for.
You manage to group the data and filter it, but it shows up in different tables, and you can never see the whole data at once. Further on there is no way to generate a bar chart that shows gifts given and gifts received for each month. Nor you can print a single report that illustrates some sort of evolution of values along time.
I was going for a single widget (table) that for each month that could sum up only two categories (gifts given and received). I hoped this widget could further on become a table: months on x-axis, and for each month, stacked or oposing columns for the two specific categories, and so on.
But, as far as I can see, such a simple report widget cannot be generated yet. Am I mistaken ?
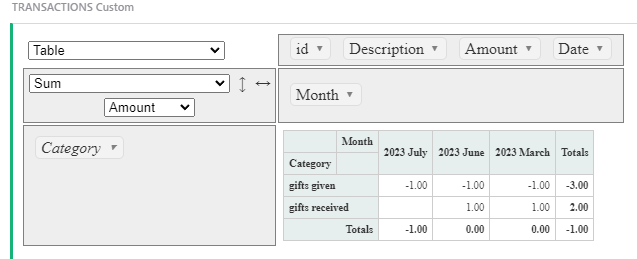
The closest to getting where I’m looking for is using a Pivot Table.
But this has it’s own drawbacks:
Individual categories are still shown (showing strictly totals was what I was looking for)
Filters reset when you switch to another Grist page,
and you cannot actually use it for generating charts
I like Grist a lot but this feels like quite a big drawback as generating precise / specific reports and analyzing data is why we use spreadsheets after all. What do you think ?
I’m wondering whether an issue should be opened on this, or added on a roadmap / feature suggestion list.
On a similar note, is there a contributors guide ?
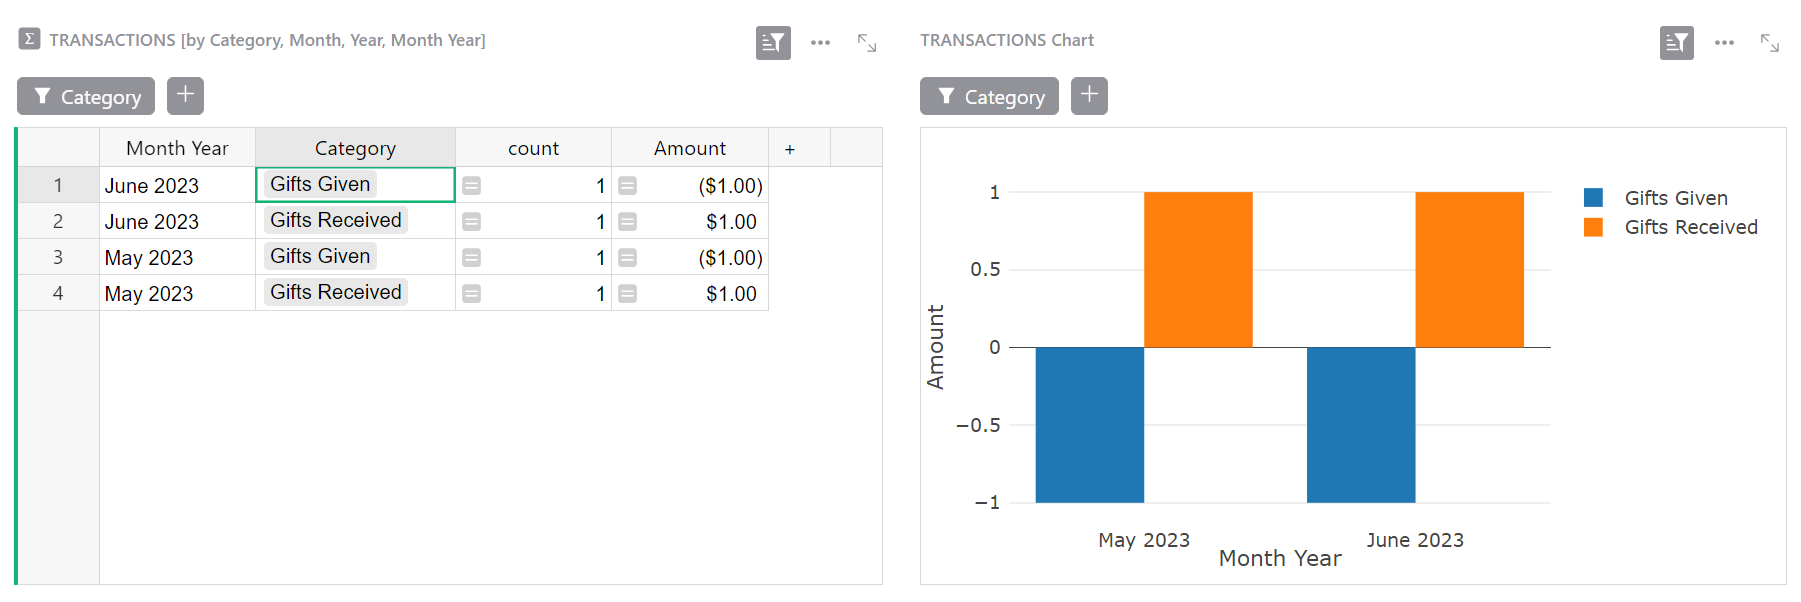
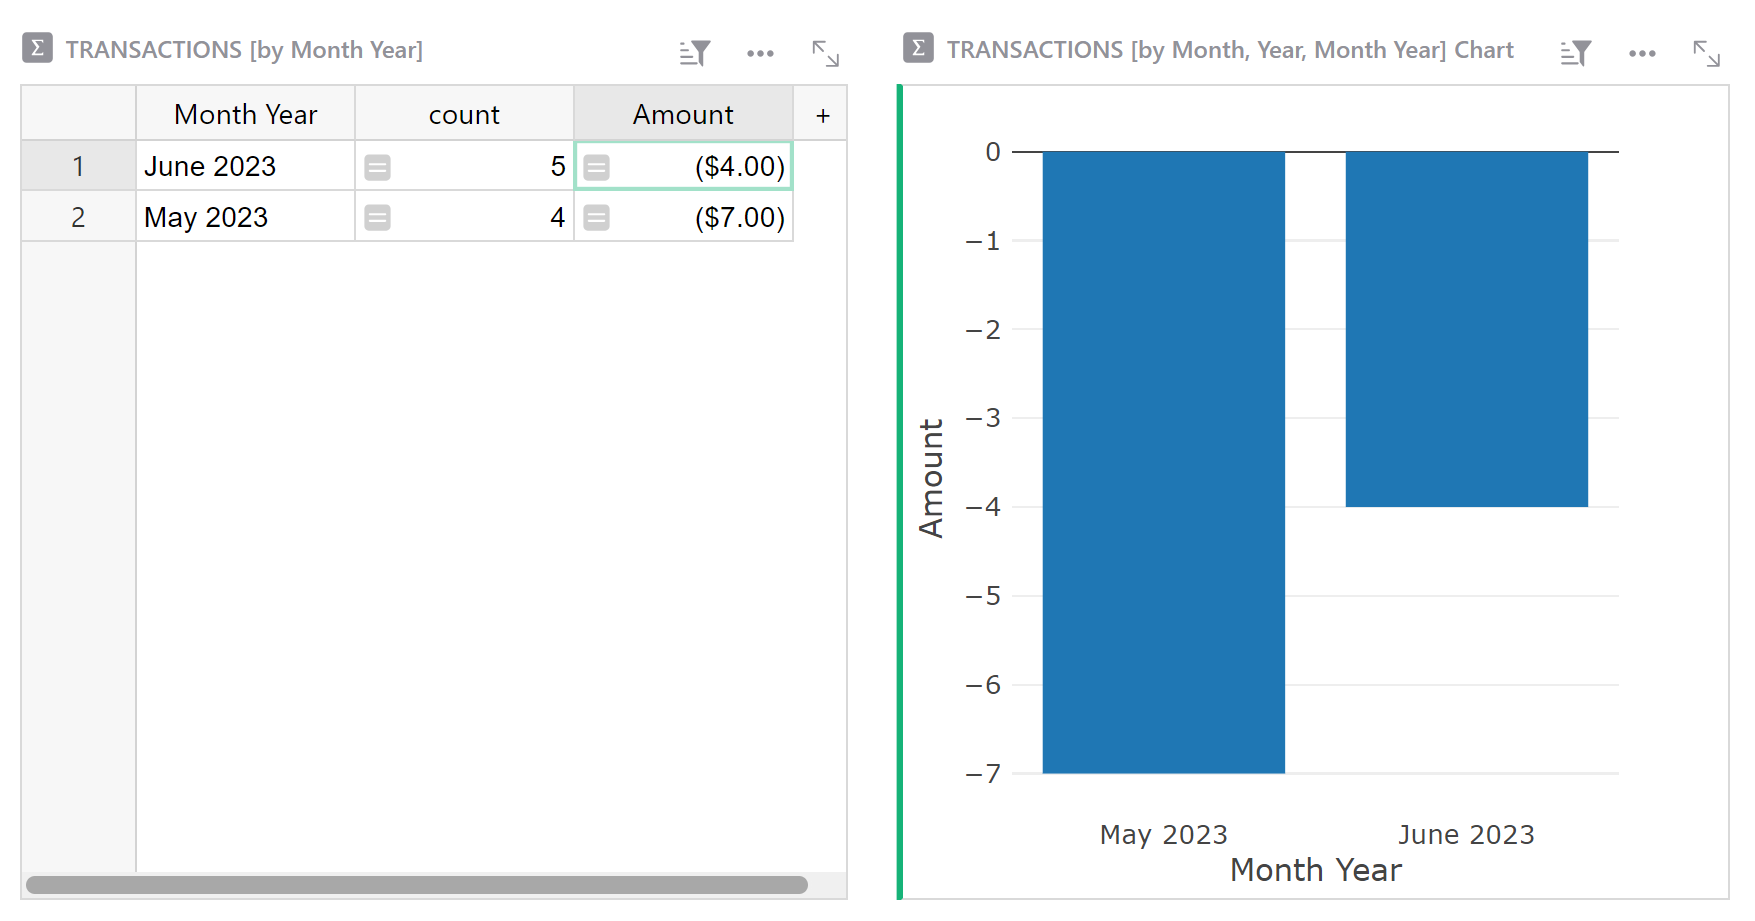
The summary table on the left and the bar chart on the right are the exact same thing - just presented in table format vs. chart format. You can add filters to bar charts just like you can with tables.
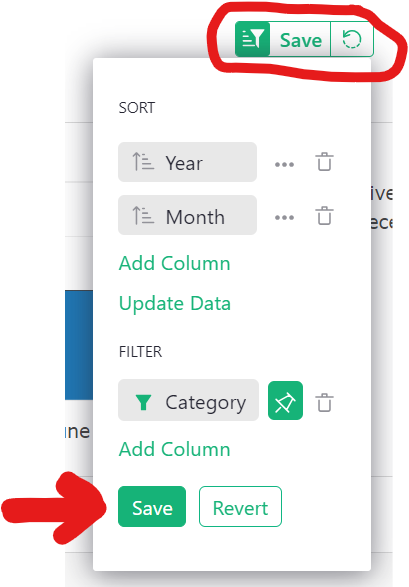
After creating any sorts or filters for a widget, be sure to click the ‘Save’ button either in the bottom of the sort/filter popup or in the filter bar at the top. Saved filters will remain in place even after navigating away. Unsaved filters will no longer be in place after navigating away or refreshing the page.
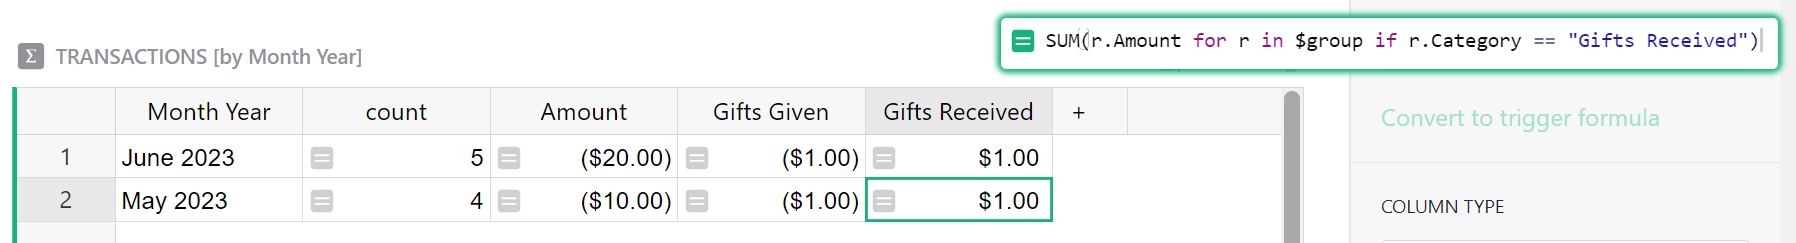
The lower table on the Bar Chart page is a summary table grouped by the Month Year column. count and Amount are normal columns populated by the summary table. I’ve added Gifts Given and Gifts Received as formula columns.
SUM(r.Amount for r in $group if r.Category == "Gifts Received")
$group is a special field containing the list of Records that are summarized by the current summary line (i.e. “June 2023”). For each record in $group, we pull the value in the Amount column if the value in the Category column is Gifts Received. Then, we use SUM() to sum all of this Amount values together.
Gifts Given contains a nearly identical formula, just replacing “Gifts Received” with “Gifts Given”.
This would be the way I would recommend going (with Category as column headers) as this will automatically add new months to the table as new Dates are added in a new month to the Transactions table.
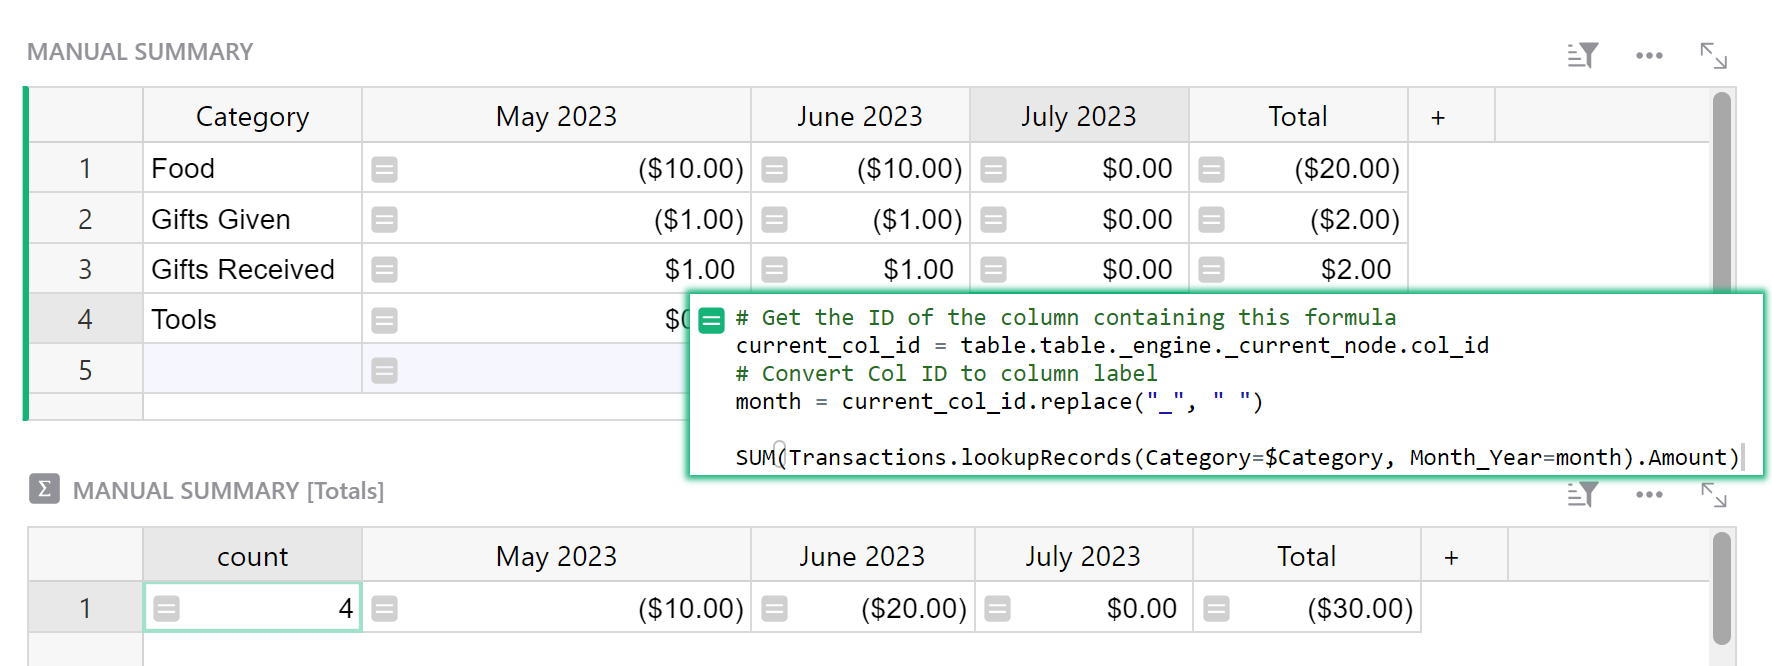
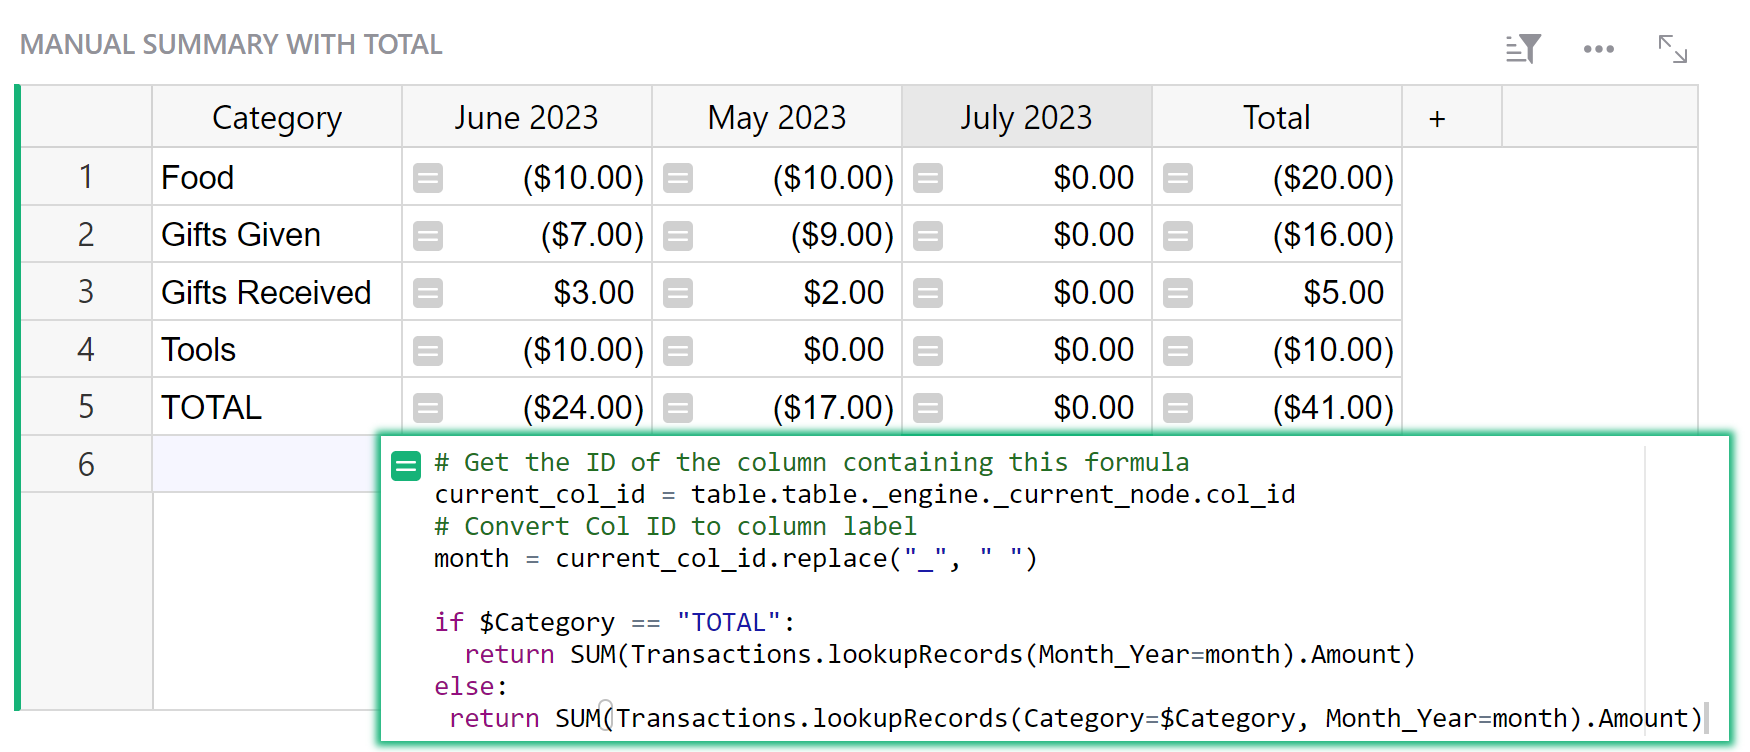
In this table, the Months are column headers. I wouldn’t recommend this way as it takes effort to maintain. Each month you would need to add a formula column then update the formula in the Total column to include the new month’s column.
You would add a new column where the column header follows the format of your Month column. My column is Month Year. The formula used in each month’s column is:
# Get the ID of the column containing this formula
current_col_id = table.table._engine._current_node.col_id
# Convert Col ID to column label
month = current_col_id.replace("_", " ")

SUM(Transactions.lookupRecords(Category=$Category, Month_Year=month).Amount)
The top portion of the formula finds the column’s ID and converts it back to the column label (by replacing _ with a space.
The final line of the formula uses lookupRecords to find all records in the Transactions table where the value in the Category column matches the value of the Category column in this row of the Manual Summary table and where the value in the Month Year column matches this column’s header. For all records that match the criteria given, the value from the Amount column is pulled and then we SUM() all amounts.
Jumping back to the first example where we have a summary table grouped by Month Year. You could skip creating the columns for specific categories and simply edit the formula for Amount.
gifts_given = SUM(r.Amount for r in $group if r.Category == "Gifts Given")
gifts_received = SUM(r.Amount for r in $group if r.Category == "Gifts Received")
gifts_given + gifts_received
We use the same formulas to find SUM() of all Amounts for “Gifts Given” and “Gifts Received” that we had used in the Gifts Given and Gifts Received columns. Then we sum those values together. If there are other categories you want to include, just follow the same format.
Amount can then be used in the Bar Chart widget.
The second way we created a table is not useful in creating a bar chart but I did create an example with a row for TOTAL. You can see this on the Manual Summary (SINGLE TOTAL) page: Community #2715 - Grist
The formula was modified to return a total if the Category is “TOTAL”.