I asked this question on Discord and got limited help so am hoping that the experts here can provide guidance.
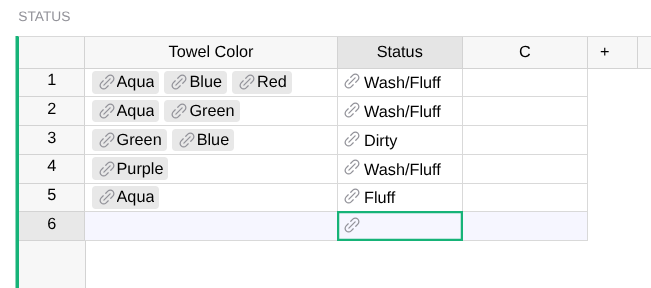
I am struggling with how to create a summary table based on a source with a multi-pick cell. Below is an image of the source table. I want to create a new table that summarizes which towels are dirty. The fluff variable can be ignored. Programmatically, I think that it would be something like: if count(blue[dirty]) > count (blue[Wash/Fluff]) then it is dirty. I have tried a number of different options, and the references seem to break things.
A couple of questions came up on Discord that I wanted to answer here:
- Why is “Status” a reference column and not a unique choice? No specific reason. I can change it easily. It was more about me using an Excel mindset. Would changing that help? (It does bring another question about when to use unique choice vs reference)
- Why is “Towel Color” a multi-pick and not separate rows for each color? I am populating this table with a form, and towels are typically used together. This drove the choice of a form with the ability to choose multiple towels. I suppose that I could change the form to force only one color per form entry, but that could be annoying, as I would need to complete the form 3 times for three towels. Alternatively, is there any easy way to force a multi-pick form to populate results into separate rows thus avoiding a multi-pick cell?
If I were doing this in Python, I would iterate through the towel color table and then iterate through this table and count each time that a given color had a given status. Then, use the comparison described above. However, I don’t understand Grist’s capabilities here. As an aside, I am running this self-hosted, if that matters.
Sorry for the lengthy post. I am open to any feedback on how to do this, including changing the current information architecture.
TIA!