if i have a date table and then create another table and use date as a reference in that new table. It works but when i create a chart off that new table using date along the axis it shows weird data:
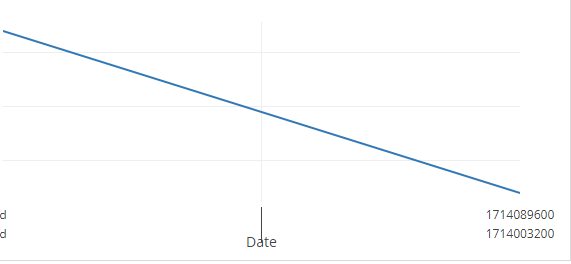
as opposed to using date as a standalone field in the second table:
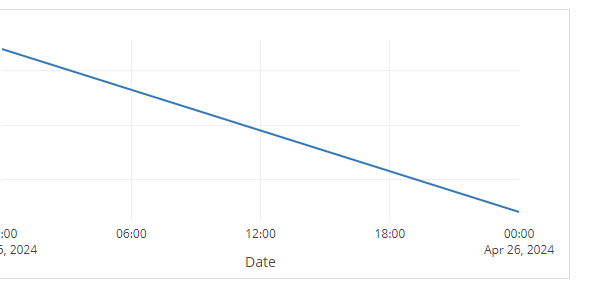
I know that date number in the lower right hand corner of the top image : 1714089600… is a linux formatted date. So seems like the chart is not happy with a reference field. any work arounds?
Try adding the date field from the referenced table into the new table, as explained in Including multiple fields from a reference.
okay i finally understood what you meant and its working. I guess since i could see this date (the reference) column it was the same, but i had to add the date as a new column from the referenced table and then use that for the grid. Confusing but it works. thanks.