Hi there,
I’m using Grist for the first time to look at some of my own bank transactions, and I’m trying to figure out how to create a summary table of a filtered view, so I can see a summary of all the things I’ve spent money on in the last month or so.
Where I am so far
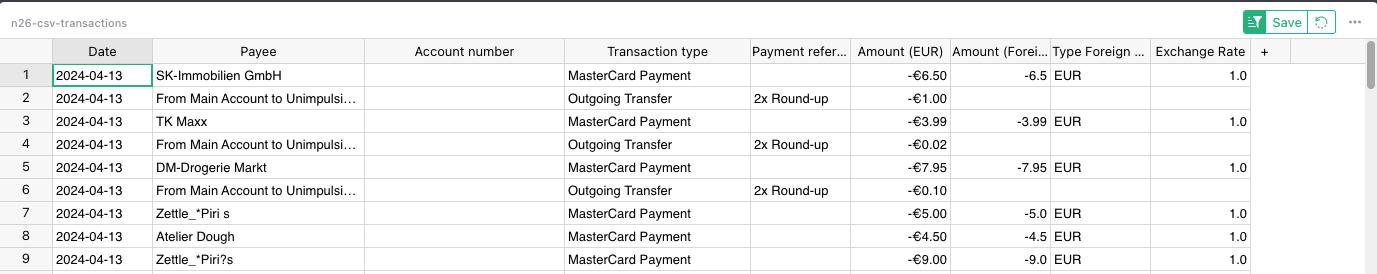
If it helps, here’s a sample of the data that I’ve exported from my bank (if it helps they’re n26, and they provide a CSV export all the day back to when I joined in the mid 2010’s):
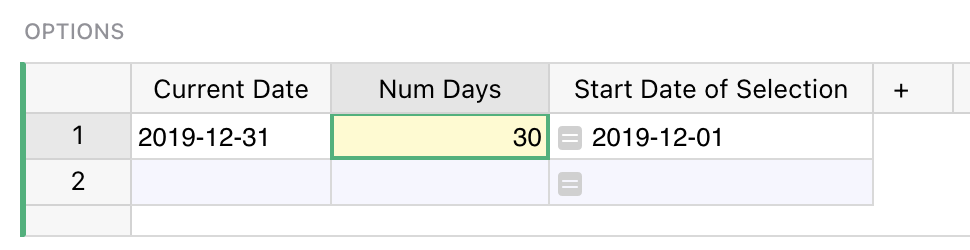
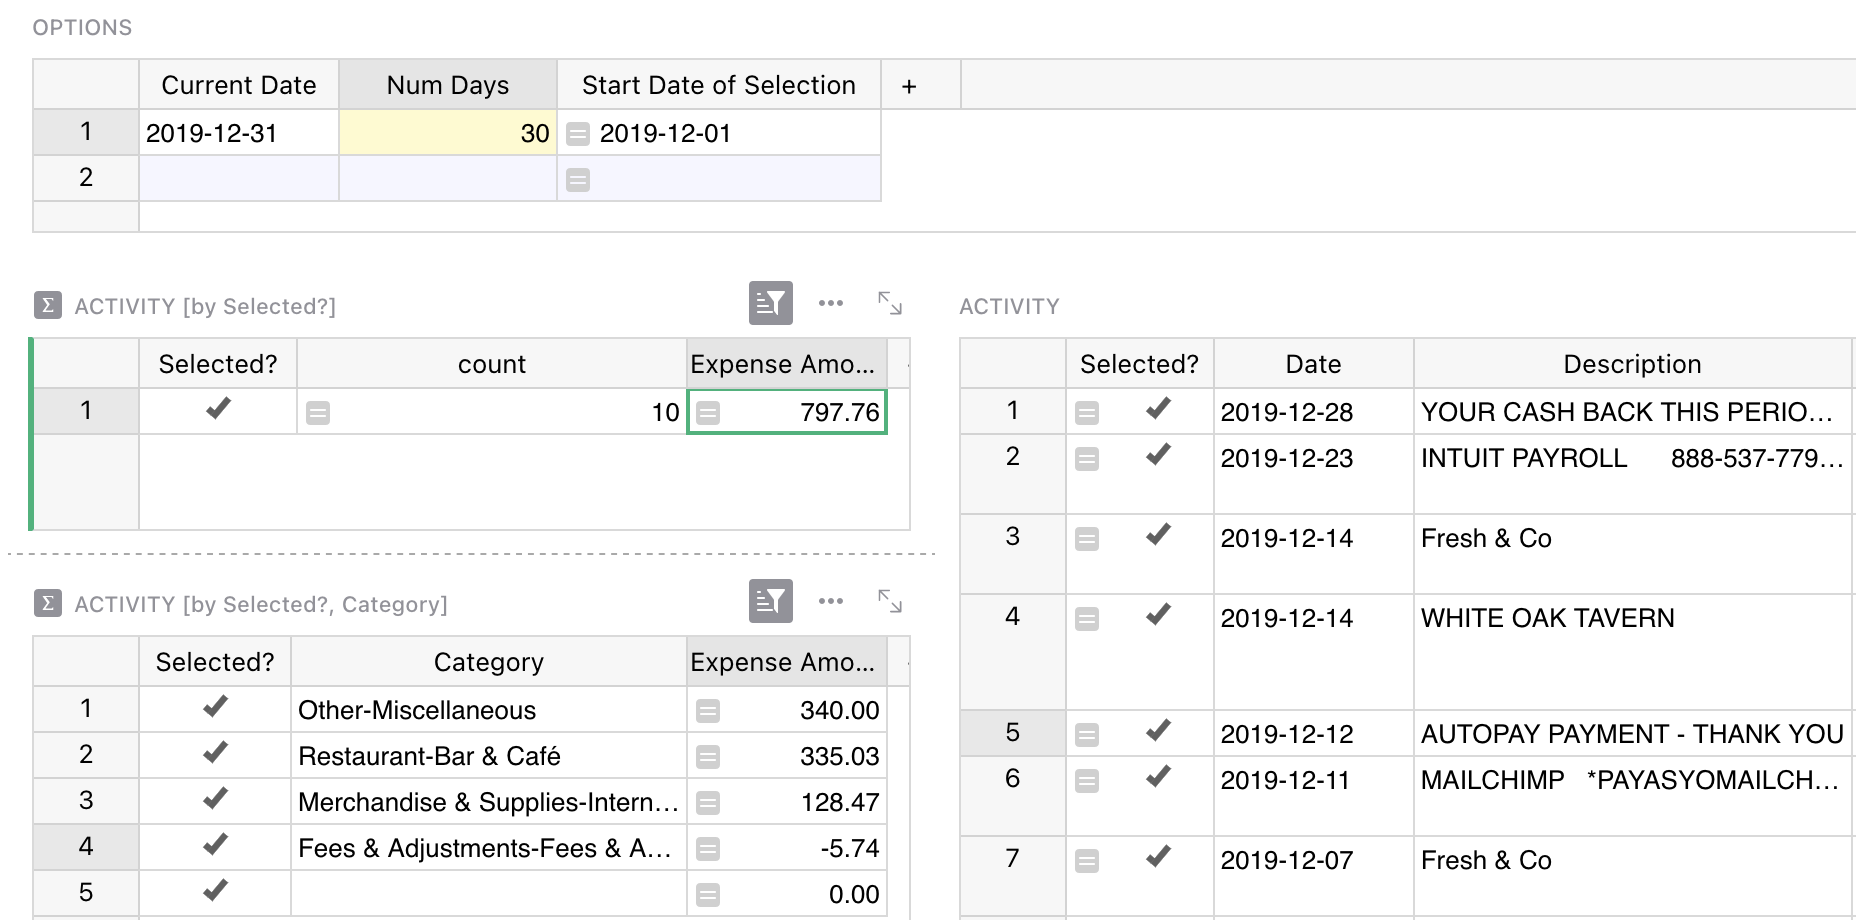
I know I can create a filtered view, to only show entries from the last 30 days, but creating a summary table creates the summary from the entire table.
A possible approach, and where I get stuck
I’ve also read there that I can create an extra boolean column and group then filter by the boolean, as described here by @alexmojaki:
I guess could try this boolean column trick, but it seems like I’d need to hardcode the cut-off date I’m filtering by to group by the boolean formula - are there any magic variables, that let me refer to the filter I have already set, like __MATCHES__FILTER_A__ or something to that effect?
This would allow me to see the summary view update, based on the range specified on the date filter in the source table - allowing me to quickly see transactions grouped by payee, in the last week, last 30 days, last 90 days and so on - and I can imagine others wanting to be able to see filtered, grouped views of a single table in other scenarios then me just fiddling around my own finances.
Thanks.