To add to @georgegevoian’s answer, in Grist formulas work on the data level, but filters are a property of the view. E.g. you can have different pages displaying the same data with different filters, and if the document is shared, different users can see the same page with different filters. That’s the reason why formulas can’t refer to filters.
However, what you are looking for can be accomplished with just formulas. Here is an example:
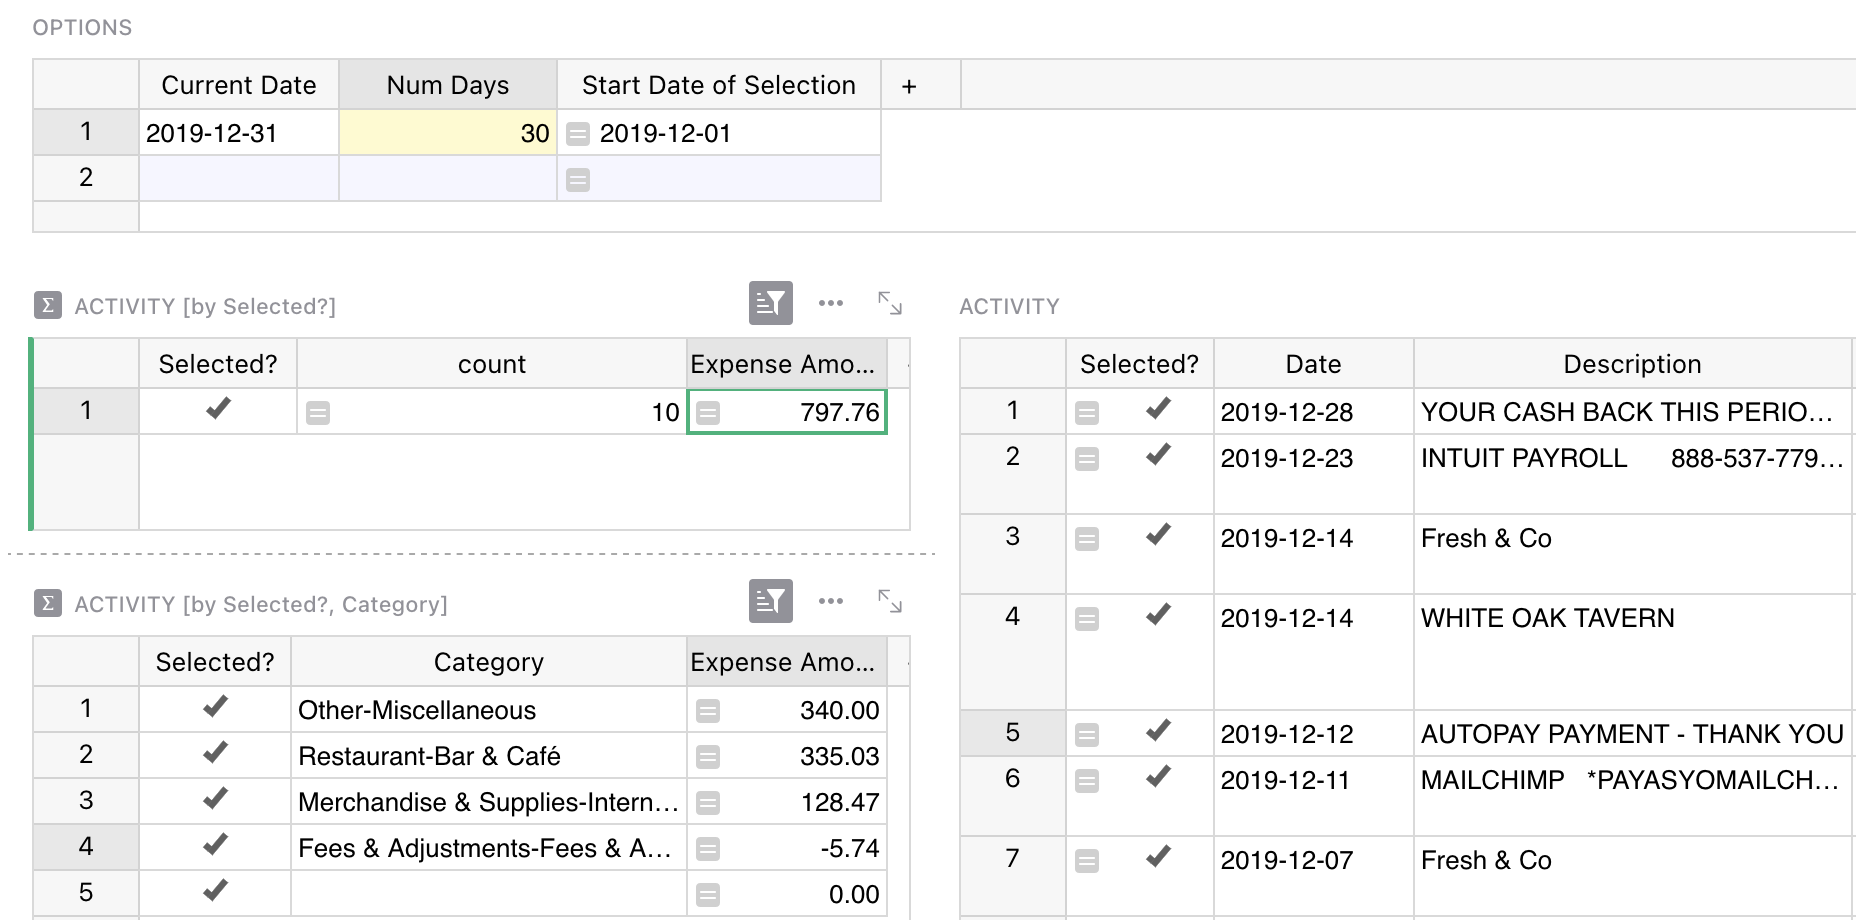
This is based on the “Credit Card Activity Template” in our template gallery, but I added a new page called “Recent Activity”. It has a section on top to define the range of dates:
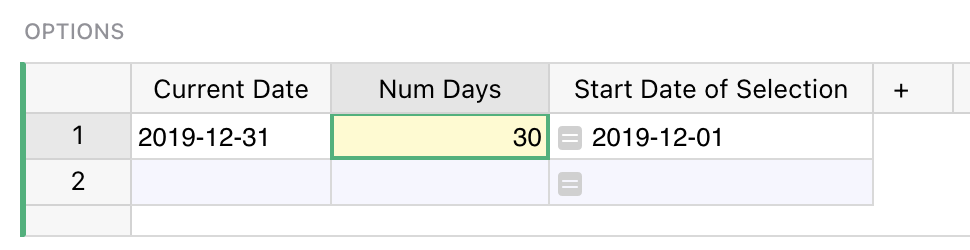
You enter the number of days into the yellow cell. (I added a manually set “Current Date” just because the sample data is from 2019, but you can adjust to make it the TODAY() formula.)
Based on Num Days, I calculate Start Date of Selection, and then the actual transaction data has a new column Selected? with this formula:
$Date >= Options.lookupOne().Start_Date_of_Selection
The result is that only the records after Start Date of Selection have Selected? set to True.
Then there is a summary table grouped by Selected? column (for total of selected records), and one grouped by Selected? and Category (for category subtotals). Both the summary widgets and the original data have a saved filter to only show selected records. (You can hide the “Selected?” column, I only left it visible for clarity of what’s going on.)
As you adjust the number of days in the yellow box, you get to see just the records in that date window, their total, and their summary grouped by category.