For example I have:
- income table (date, amount, invoice )
- payouts table (date, receiver, comment, hours, amount)
and want to combine them into 3rd one (date and amount only) and order everything by date to see the money flow.
What is the best way to achieve this?
3 Likes
We’ve been thinking what to suggest.
One possibility is to actually hold this data in a single table, with columns (date, type, amount, invoice, receiver, comment, hours), where type is “income” or “payout”, and where some fields are used for type=="income", and others for type=="payout". Then you could summarize easily by date, or by combination of date and type.
If the data is in separate tables, combining records from them is somewhat tricky. Grist doesn’t yet offer a convenient tool for it, but there are some approaches. Let me clarify first what you are looking for: a table with one row per date, containing a sum of income, sum of payouts, and sum of both? Or a table with one row for each row in income table, and one row for each row in payouts table (even if there are many rows for the same date)?
A table with one row per date is easy to make as a summary of one of your tables, e.g. Income, grouped by date. In each row, the $group column (described here) will contain the summarized records from Income. The records from the Payouts table can be obtained using lookupRecords: Payouts.lookupRecords(Date=$Date). So you can get the totals per date as:
- Income:
SUM($group.amount)
- Payouts:
SUM(Payouts.lookupRecords(Date=$Date).amount)
The remaining difficulty would be if Payouts contains some dates that are not in Income; then the summary table wouldn’t include those. That’s where we’d need to find a workaround, if that’s a problem for your case.
1 Like
Hm, that is now even more interesting 
2 tables approach:
Yes, the date is not the same. Income could contain any day as I have YYYY-MM output and it’s really a table to count hours worked and sums of money.
And the payout differs and could be any date and sometimes even 1 in 2 months but YYYY-MM-DD.
So this will not work.
I have thought about scenerio like:
- query data (YYYY-MM-DD) columns from table1 and table2 in python, merge and output to colA (column formula), I’m fine to read Python docs and I think it’s just some list object or set of objects or whatever it called in python.
- query for items in table1 to colB, query from table2 to colC. Both lookupRecords() based on date. Hide both.
- output colD as sum of B and C. And since there is no overlap between them, I get a value for each cell.
1 table approach:
It’s good but if could make it this way:
- Create a table for everything with column type.
- Create custom table/widget to fetch only typeA and same for typeB values.
- Hide unnecessary columns for this tables to keep it visually simple.
- Be able to add date to this table that will be automaticaly marked as typeA/typeB (like filtered values must be added to corresponding table).
ps: I got something similar in my crm system where I could create my custom lists and everything I add also contains exact list parametres.
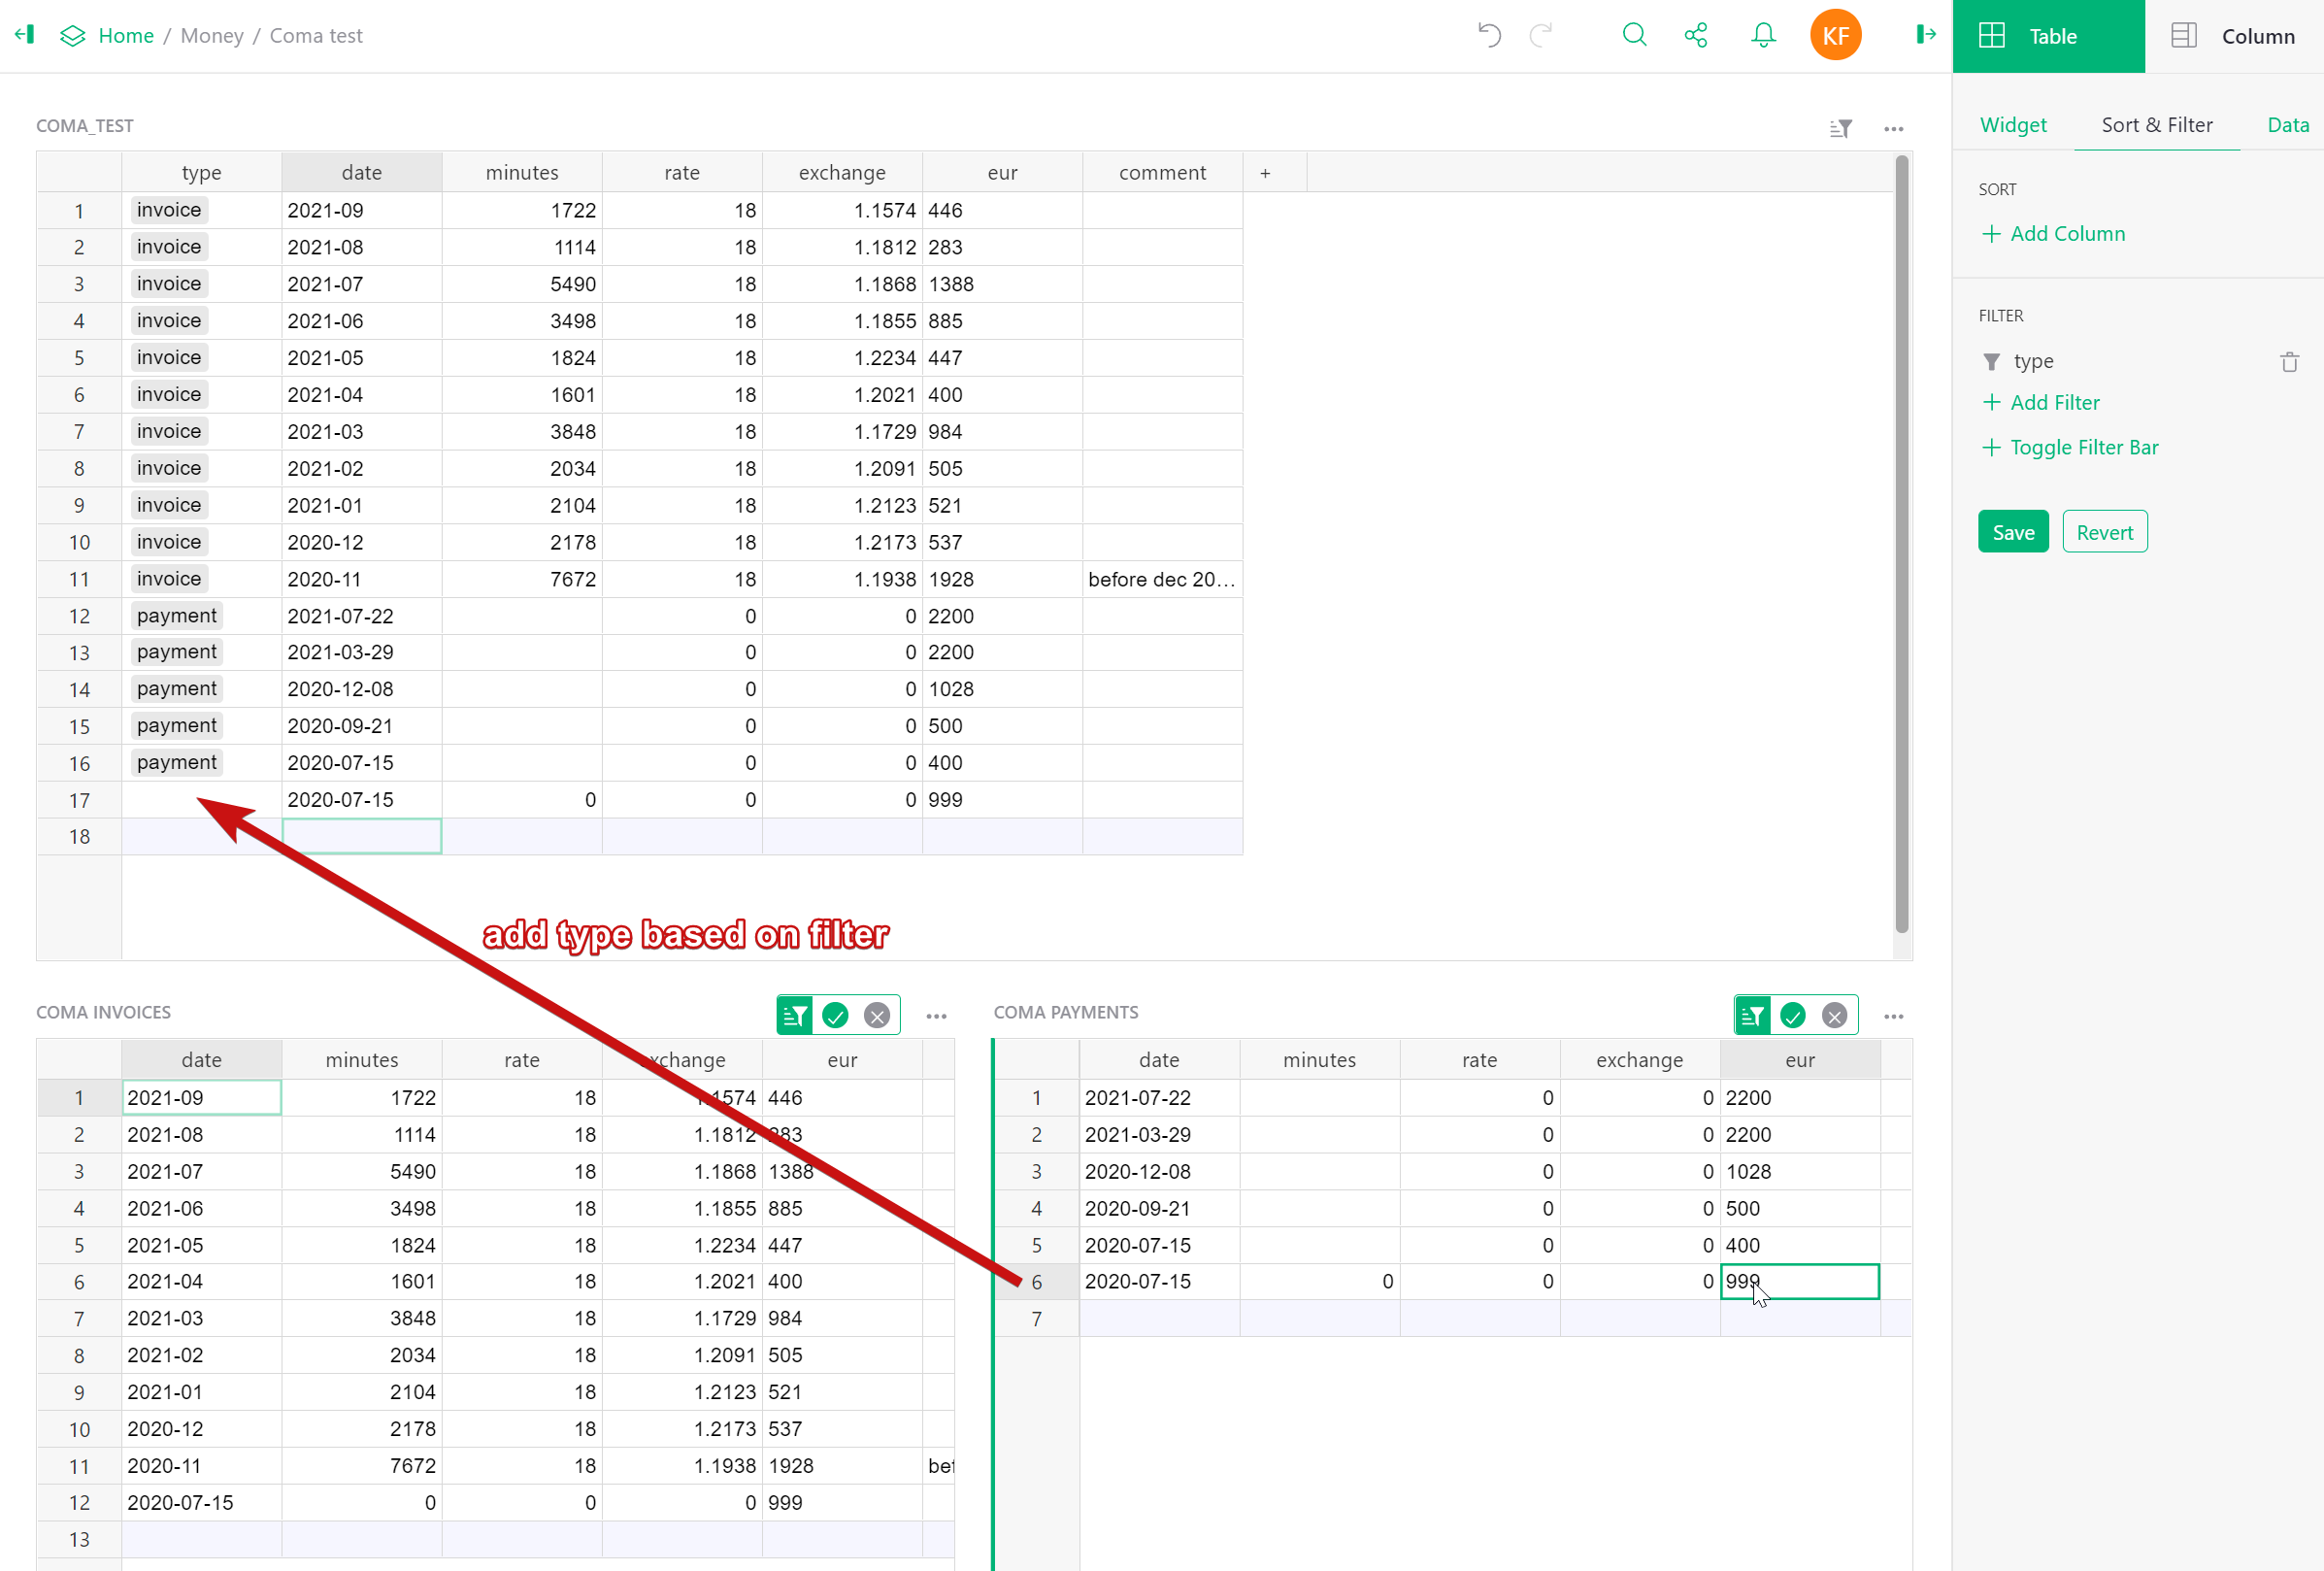
I have created an example: Single table and 2 filtere views of it(but i have to keep type column visible)
- just understood that I’m really missing an ability to sort based on hidden field. It’s type for this example but I had same difficulty before when I imported db table and hide id col as I don’t need it to work with data but still need everything to be ordered by initial id.
ps: I hope it’s okay that I am boring you with all these things. It looks to me like you guys made a deal to get no only more customers but some fuel for further project tuning. At least I hope it’s useful for you too, because it’s more interesting to me to use Grist and sometimes change tools then really needed. Just try to make something more productive and automate as much as possible. But everything I try now worked for me before in gsheets. (except api experiments)
You’re not boring us! We appreciate you’re using the forum. It’ll help other Grist creators as well.
Being able to filter by a hidden field is on our roadmap! I’d like it too.
By the way, we have a General Ledger template that might be useful to you with some modifications. I am seeing a lot of similarities in the use case. In the template, Income and Expenses are in separate columns, but there’s no reason it has to be that way.
I made a quick modification to the template that gets us closer to what you’re looking for with the “Type” column. I made a video to better explain the differences and what the template is doing. The video is attached to the example template in a page called “Watch Video.”
See, I’m not bored at all, because I secretly like making these videos. 
@anais-grist so there is no way to merge two date columns of different tables into a date column of another table?
No conveniently. Could you explain your use case in greater detail? I might have ideas or suggestions when I better understand the type of records and the goal.
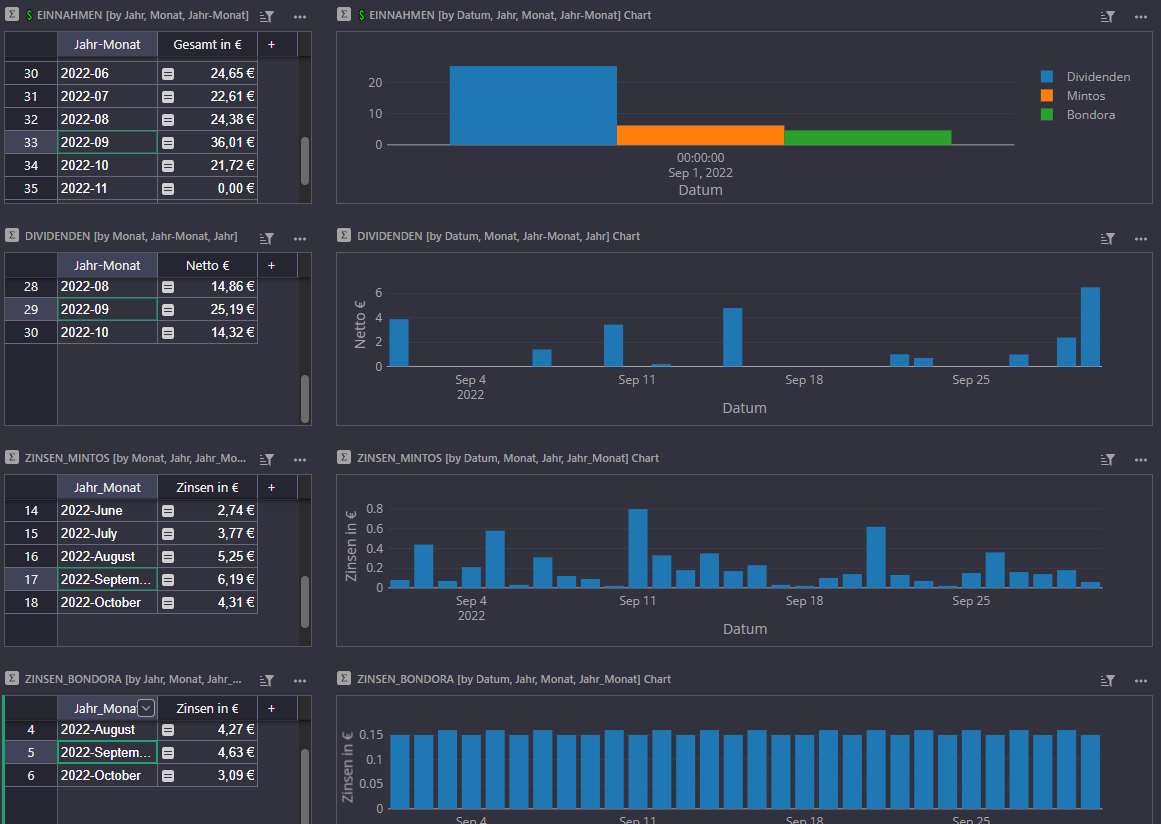
Hi @anais-grist, my use case is to create a dashboard to track my income streams.
In the image you can see that I have a table for each of my income assets: stock interests, p2p credit interests Bondora + Mintos.
When selecting the month on the left, you can see in the charts on the right the aggregated income per day. I would like to create a summarized chart of total income per day.
So the question is: How can I merge the 3 tables’ date columns together into the total income table?
@Haidosu, did you find a solution? Trying same thing right now.
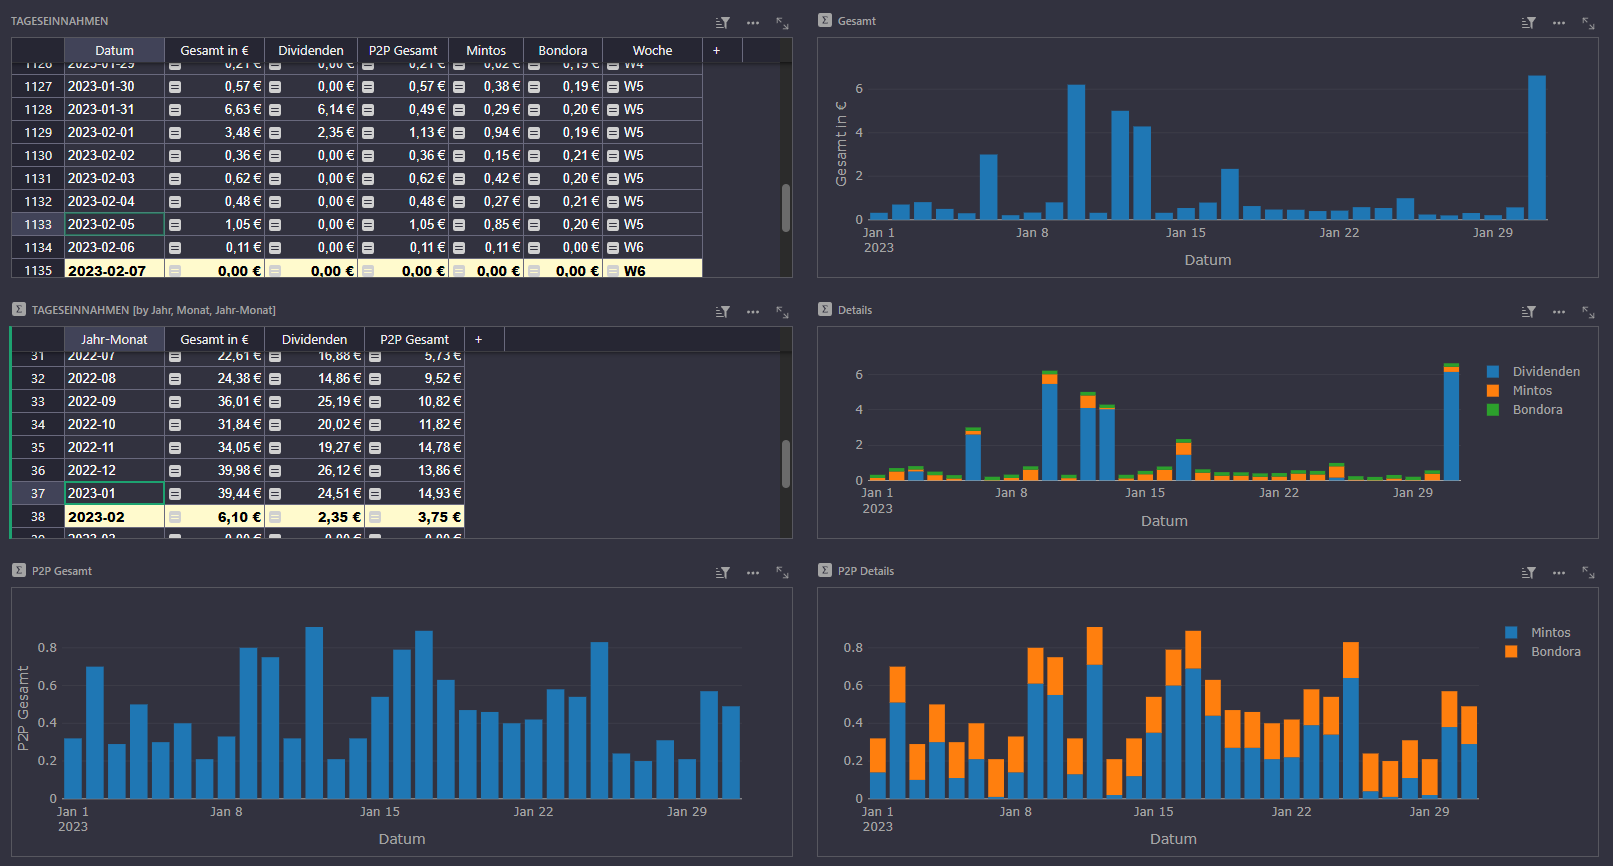
Hi @Antoine_Guerin, I made a workaround that works.
Here’s a video of how I made it:
In short: If you sort your data by date, you have to create a date column inside the table you want to merge the data from other tables into. Then add a column for each data set you want to have inside your table. You can then use the following formula to let your data appear:
year=YEAR($Date)
month=MONTH($Date)

values_you_want_to_collect = SourceTable.lookupRecords(Year=year, Month=month).Value_you_want_

return sum(values_you_want_to_collect)
Keep in mind that if you want to collect data by year and month, you have to add a table for year and month inside the data table you want to retrieve data from.
There might be better solutions available, but this approach works fine for me.
2 Likes