Hi there!
I am creating a chart to log tips from a sportsbook tipster, and I am struggling to create a running total profit chart.
I’ve shared my sheet here (With test data): SportBettingTracker
The problem I am having is creating the chart “RunningTotalProfit [by Tipster]”
I want this chart to be a running total, rather than a spreadsheet that just shows profit per day.
Is there an easy way to do this?
I tried briefly to create a summary table to try to show a running total, but then I ran into 2 problems. 1, splitting the data per tipster, and 2 creating a chart from that data(Is it even possible to grab data from a summary table?). I could not find a way to create a chart from the summary table “ByDayProfit” to have a running total.
Can someone assist me on what I’m doing wrong, or if it’s even possible?
That is exactly what I intended! Thank you! My thought was to have the chart change based on which tipster is chosen, but having both shown works too. In any case that’s an easy fix.
I’m very confused as to what you did to create that, I was not able to create a chart using the summary table. I’ll have a look at what you did and try to learn from it.
Thank you! I really appreciate the help.
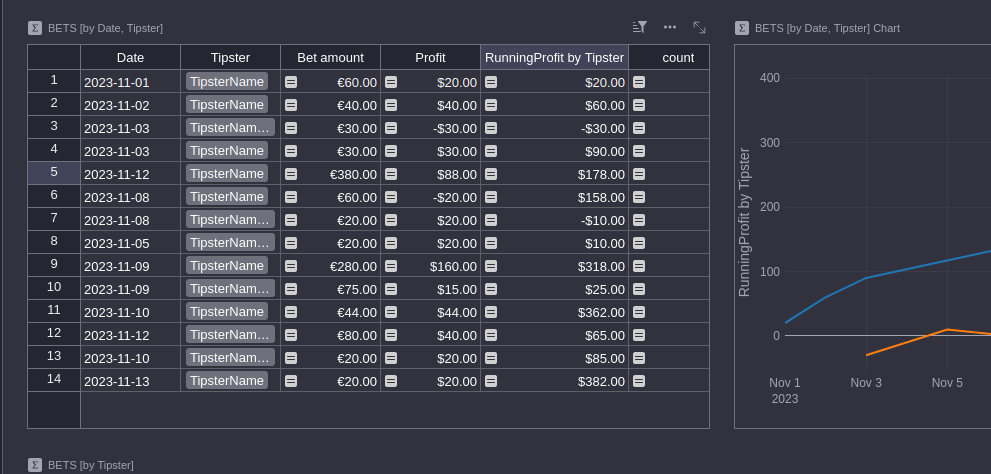
The fact is that the chart doesn’t use the Bets [by Date] summary table. Looking further, you’ll see that RunningProfit by Date isn’t the same thing (and hence not the same formula) as RunningProfit by Tipster.
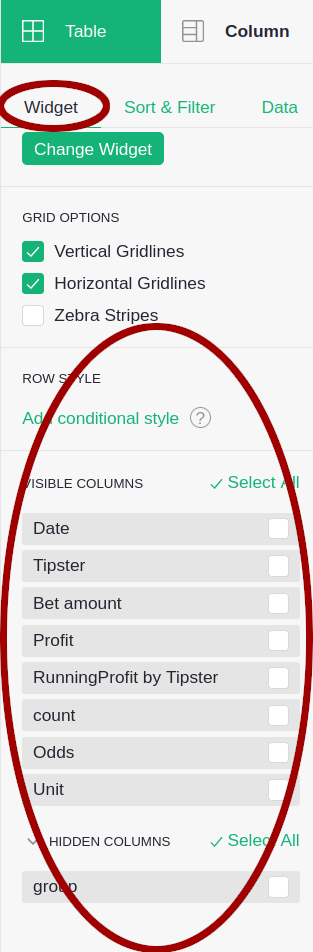
That said, once you have a summary table with the formulas you like, it’s quite easy to use it for a chart: you have to define your chart with exactly the same data selection (group by) as the summary table. By default, the formula columns you added to the summary table will be hidden, but you may make them visible:
After looking at the spreadsheet for a couple of hours I understand what you did and how you did it and was able to replicate it. I’m amazed at how you came to the conclusion to do it this way. I have a lot to learn! Thanks again.
Hey, unfortunate news. The formula does not compute correctly.
The issue is related to the date, I’m not sure how the sorting is done, but the IDs and the dates are incorrect, leading to the runningtotal being calculated incorrectly. The end number is correct, but the order is wrong.
Was in the process of creating 2 lists of dates + indexes, then creating list, and then sorting the list, and then pulling indexes in that order.
Thanks, that’s much simpler!