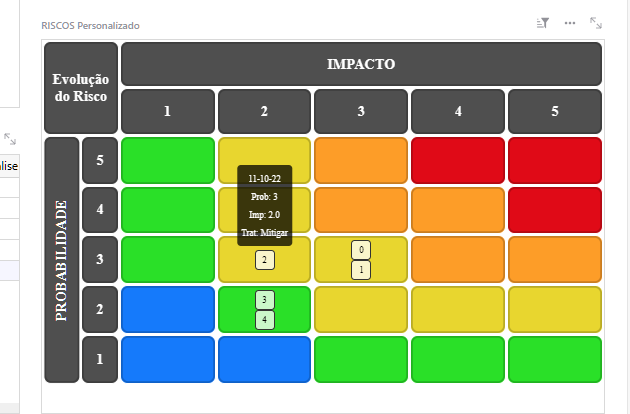
I am trying to create arrows to connect the different Risk Analysis in order. But I need the coordinates of the elements being created. I guess only way to do that is with Javascript, which from my tests doesn´t work with Grist.
Drawing an arrow in HTML works… but I can´t change it’s start and finish points based on the widget stretching or squeezing the matrix cells.

I haven’t looked into your HTML at all, but maybe you can use CSS anchoring to connect arrows to each of the Risk Analysis in order? That would avoid using Javascript.
The last link shows how you can attach multiple anchors to an element, which makes me think maybe you can attach one end of an arrow to a first Risk Analysis and the other end of the arrow to the next Risk Analysis.
