I understand how to create a summarized table, but I’m not seeing an option to create a crosstab table. Is that an option?
There’s a few ways you could approach this in Grist. I made an example for you covering multiple approaches. Creating cross-tabulation
We have a table listing survey respondents in different cities. They have a preference for Cats or Dogs.
Method 1 - Page “Cross Tab Style”
- Create a summary table grouping by city. Grist automatically counts how many records are in each city.
- Create formula columns for Cats and Dogs. Let’s start with cats. The formula is
len(list((r for r in $group if r.Preference == "Cat")))
len counts characters in a string or items in a list.
We want a list pulled from the $group. $group is a special field generating records that are summarized by the current summary line. i.e. the city.
We want to modify $group to list only those records for which the preference is cat. In Grist, we can define r (records) as those records in $group if the record’s Preference equals the string “Cat.”
r for r in $group if r.Preference == "Cat"
Note the double equal sign. In Python, a single equal mark assigns a value to a variable, whereas two equal marks is used for comparisons. Cat is in parenthesis because we’re matching to a text string.
Do the same for dogs.
len(list((r for r in $group if r.Preference == "Dog")))
There’s drawbacks to this method. If you know the data’s structure won’t change much over time, this could work. However, if the survey might expand to include guinea pigs, parrots, goldfish, and teacup pigs, this method isn’t ideal. You have to hardcode the values and constantly create new columns. It makes the team more dependent on the document creator.
Method 2 - Page “Linked Summary Tables”
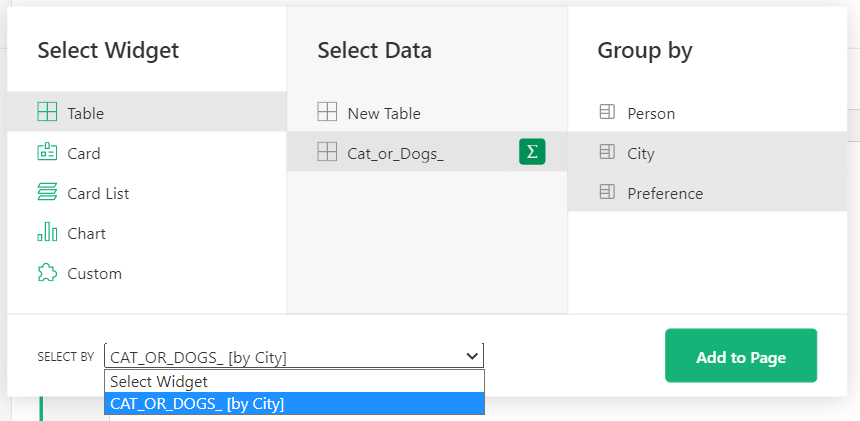
- Create a summary table grouping by city.
- Create a summary table grouping by city and preference. Link this summary table to the first one, using the “Select by” field when creating the widget.
Clicking into each city will show the break down of preference between cats and dogs. And if the underlying table suddenly has guinea pigs, parrots, goldfish, and teacup pigs, Grist will know what to do with that, without anyone having to create additional formulas.
Method 3 - Page “One big summary table”
You could also create one summary table grouping by city or preference. It’s not quite as pretty as a cross-tabulation table, but it will accept guinea pigs without fuss.
Thanks, Anais.
Adding a cross-tab table that looks like the “Cross Tab Style” option, but is dynamic would be a nice enhancement.
2 Likes
I agree! It’s great feedback. I’ve made a note of it.
1 Like