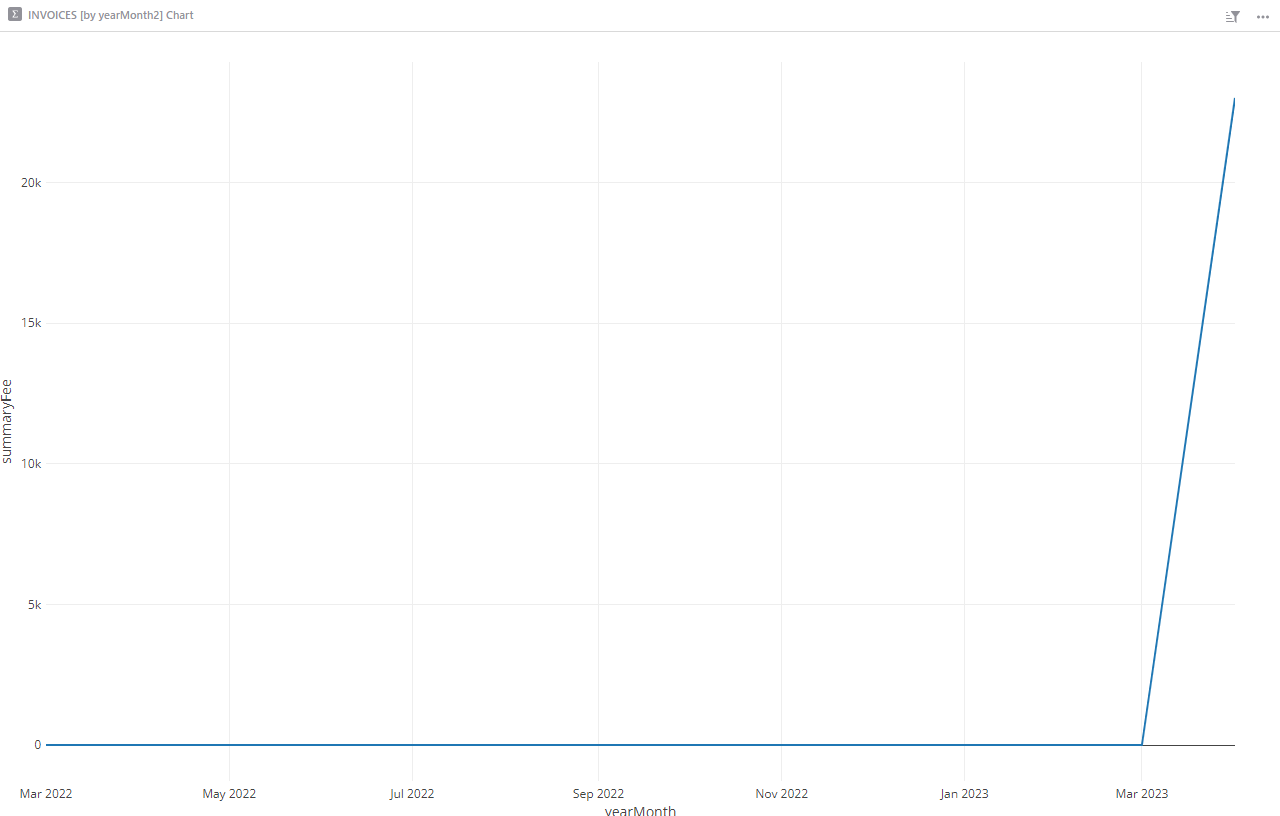
Charts naturally use summarized data. For instance, in your example, the charted points are the pairs (yearMonth, summaryFee). The original table may have many points with the same yearMonth value, but the chart needs a single number to plot. Summary tables are a natural way to compute that number. You can see which data goes into a chart by using the Show Raw Data option in the widget menu for the chart.
Different summaries of the same table share the formulas for same-named columns. This is why changing the formula for summaryFee in the INVOICES [by yearMonth] summary table affects also the formula for summaryFee in the INVOICES [by clientKey] table. Sometimes this is great, because the column is consistent (e.g. always SUM in every summary, or always AVERAGE in every summary). Sometimes that’s unexpected, as in your case. It’s made worse by some inconsistencies in how these formulas are synced across summary tables; I am not sure if that’s affecting you as well. (Those are something we’d definitely like to improve on.)
One way to side-step these issues is to avoid modifying the auto-generated summary formula. Normally, when summarizing a table with a numerical column X, Grist adds a column X to the summary table with the formula SUM($group.X). This behavior is relied on by charts, in particular. When you need a different formula, the suggestion is: instead of modifying such an auto-generated column, you can add a differently-named column with the formula you want.
Ad 1.
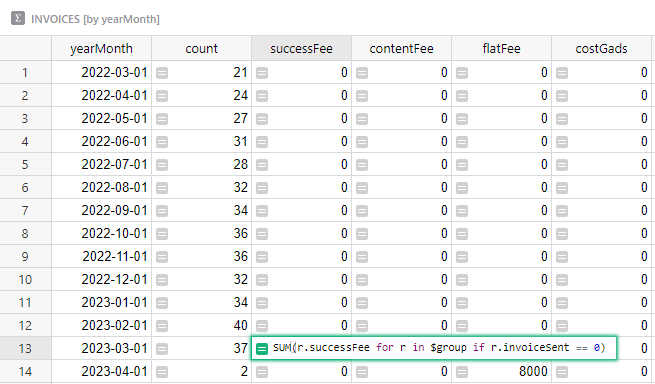
Raw Data is showing that chart (INVOICES [by yearMonth]) is based on INVOICES [by clientKey] instead of default table INVOICES. I know that because it has formulas from there where I want to show only value from not yet sent invoices. Screenshot:
Ad 2.
In my case, I need to use custom formulas (like in screen above) because I’m using the card widget to show invoices I need to send. (For example, 1 client has 4 invoices, so I sum them into 1 invoice).
Edit 1:
Building chart on other column is giving same issue.
What I meant is that if your chart should use the column successFee which should add up all invoices (not only the unsent ones), then:
Revert the summary formula for successFee in INVOICES [by clientKey] to the default formula SUM($group.successFee).
In the INVOICES [by clientKey] summary table, add a new column to that table, with a different name (e.g. “invoicesToSend”) with the modified formula (i.e. SUM(r.successFee for r in $group if r.invoiceSent == 0)).
@dmitry-grist
Hi again,
I would like to ask if the solution to this problem will be implemented in the future? (all pivot tables individual from others pivot tables)
As far as the proposed solution I constantly use but now my team needs many pivot charts for many variables. This causes that currently I have to copy all the columns needed and give them different names. My basic table has 22 columns so copying them repeatedly causes the number of columns to swell incredibly…
The problematic case you mentioned earlier was when you needed a custom formula for “invoices to send” which only made sense for a particular pivot table (INVOICES [by clientKey]), and the formula was SUM(r.successFee for r in $group if r.invoiceSent == 0).
Are you saying that many columns need different customizations in different instances of pivot tables? When the formula is the same, you shouldn’t need to make copies of columns.
We do want to improve behavior, but haven’t come up with a fully satisfactory approach. In particular, consider the situation where you have a summary table INVOICES [by clientKey], then edit the configuration to change it to INVOICES [by clientKey, isPaid] (i.e. adding a second group-by column). Would you expect formulas to stay unchanged (e.g. the customized formula for successFee)? Further, as long as we allow changing group-by columns, you could change them to INVOICES [by yearMonth], for which you might have – in another page perhaps – same-named columns with a different formula. In this case, should the formula for successFee switch to the one present in the other page?
In short, what’s hard to reconcile is the expectation that pivot table columns should stay the same (as much as possible) when group-by columns are changed.
It sounds like in your use case, this might be more of a disadvantage. If you can describe your case in more detail and perhaps share a copy of your document (without sensitive data), that may help come up with a good solution.