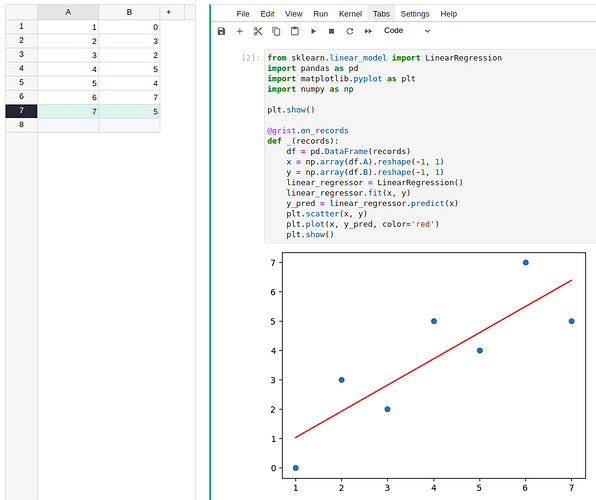
I don’t think we can add the Analyze tab from Chart Studio. But your use case is a good fit for the new Jupyterlite notebook widget. Here’s an example:
Code:
from sklearn.linear_model import LinearRegression
import pandas as pd
import matplotlib.pyplot as plt
import numpy as np

plt.show()

@grist.on_records
def _(records):
    df = pd.DataFrame(records)
    x = np.array(df.A).reshape(-1, 1)
    y = np.array(df.B).reshape(-1, 1)
    linear_regressor = LinearRegression()
    linear_regressor.fit(x, y)
    y_pred = linear_regressor.predict(x)
    plt.scatter(x, y)
    plt.plot(x, y_pred, color='red')
    plt.show()
