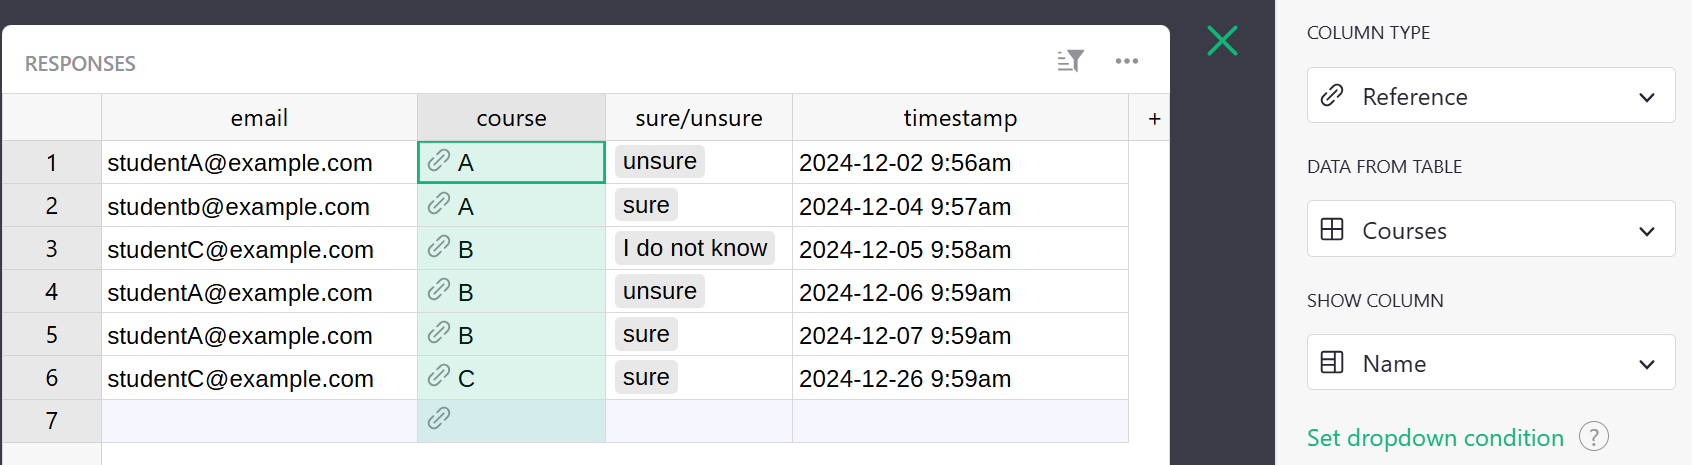
I am trying to convert from Google Forms / Google Spreadsheets an app that we use to collect students’ wishes pertaining to the optional course they want for the next semester (either SI or INFO)
As it stands, the form allows each student to specify their name and email, and the course they wish along with the certainty of their choice. They have 4 choice, combining SI/INFO and sure/unsure, and a 5th “I do not know” choice. They may change their mind during, by submitting the form again.
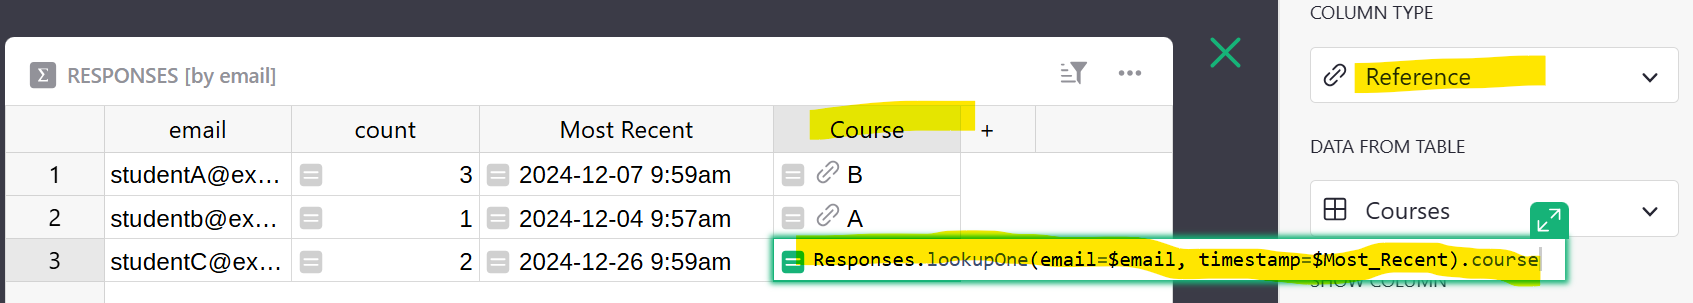
So I have a data table in Grist, named Reponses, with each of their inputs and the corresponding timestamps. For a given student (identified with their e-mail address), only the most recent entry is relevant, so I created a table view, named Dernieres, linked to the data table with a grouping by Email. This view has the Email as first column, the most recent timestamp for this Email as second (column Maj with formula MAX($group.Timestamp)), and the relevant data as other columns (eg. $group.Choix[$group.Maj.index($Maj)]).
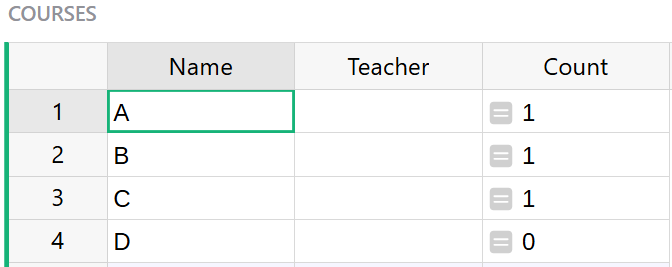
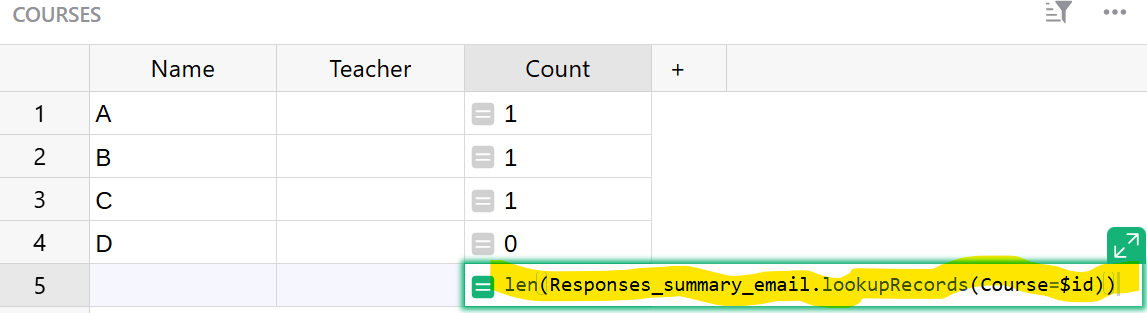
Now I want to compute statistics from this intermediate data : how many students want each course, and how many are sure.
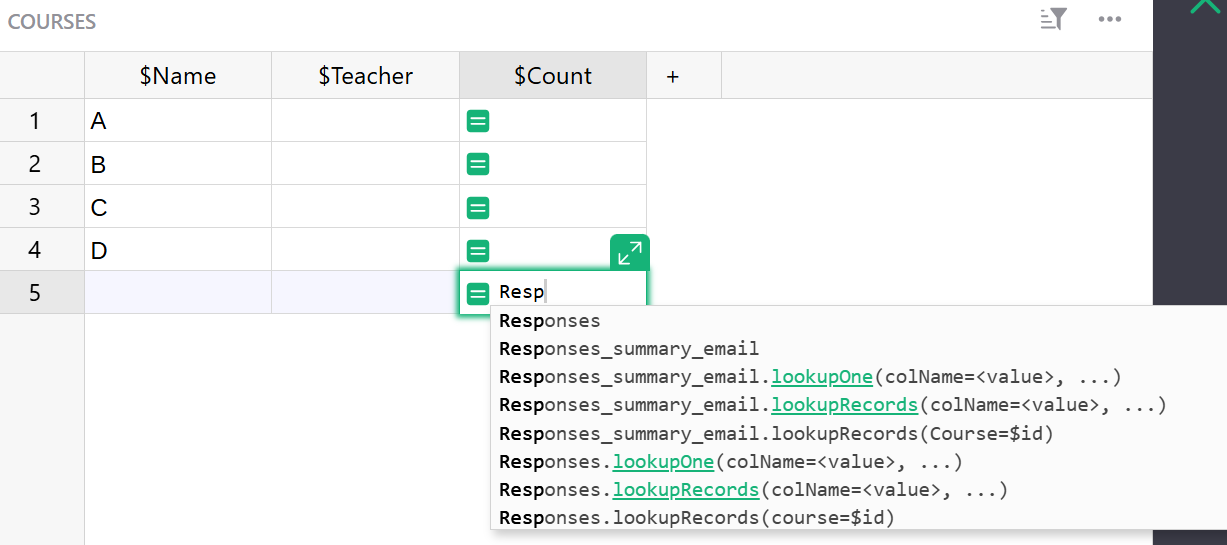
My problem is : I cannot seem to refer to Dernieres in formulas (eg. to build a graph, or another table view). Grist seems to consider data tables differently from computed tables, with is confusing to me because this is neither the case in a spreadsheet or in SQL (a SQL view can be used in the FROM clause of another view).
Is there something I am missing ? Or maybe there is an entirely different and better way to achieve what I want in grist ? I do not want to freeze the intermediate data, because I want the statistics to update as students change their minds.