In our school district, we use a custom tool to present student assessment files during orientation committees. Each student is evaluated on a set of criteria and visualised as radar (spider) charts.
Since the beginning of this school year, we have been receiving data from schools through Grist, so I built a custom widget to replicate that radar interface directly inside Grist.
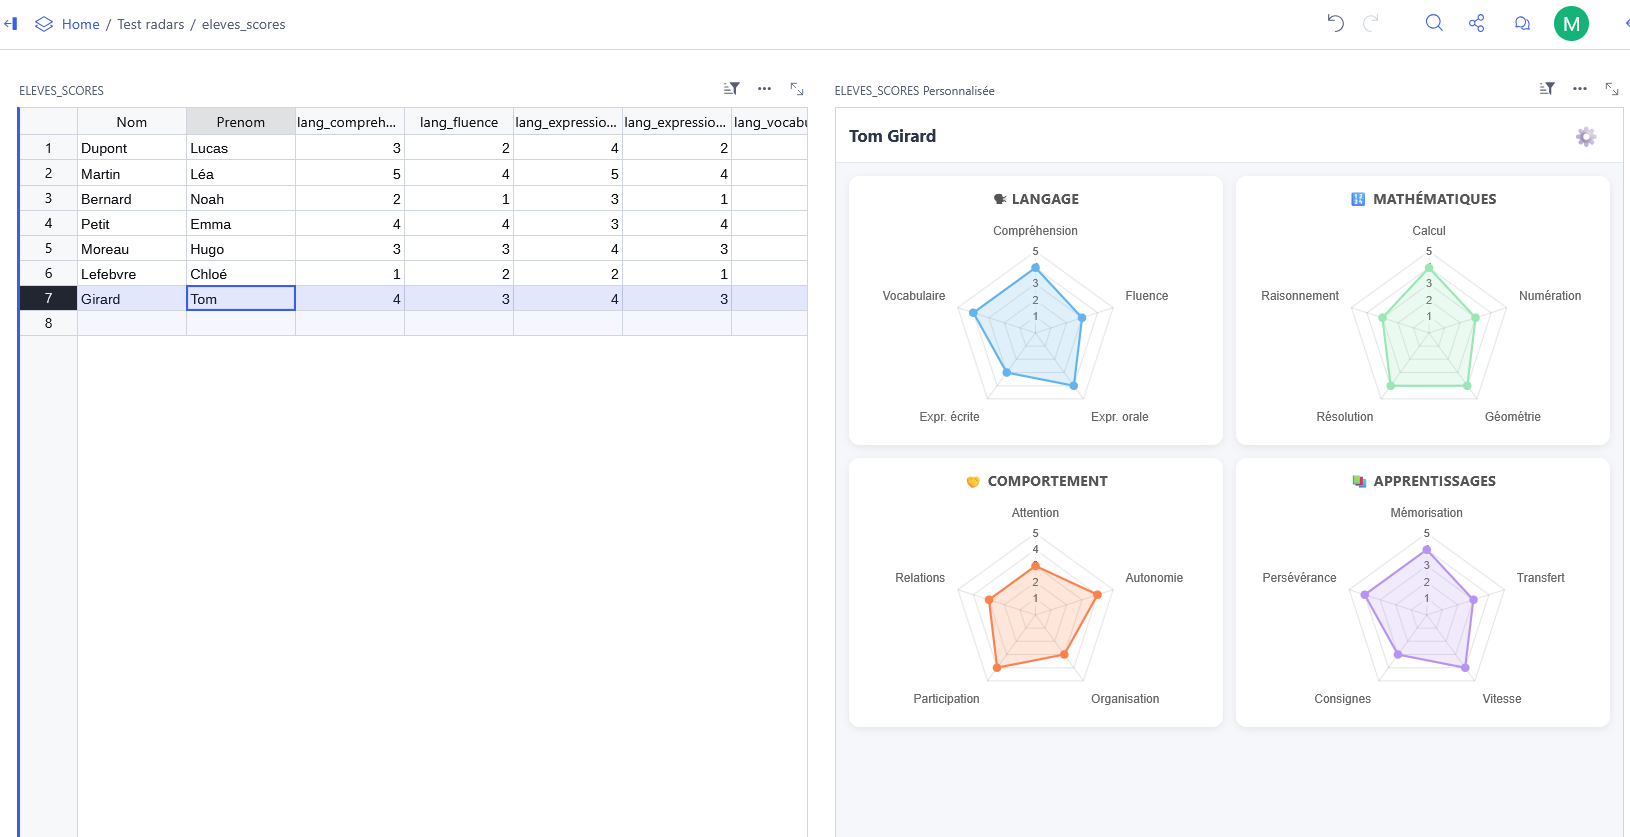
Here is the result using the Chart.js library: Test radars - Grist
Source files and documentation: GitHub - maximelacoste/grist-radars: A radar/spider chart visualisation for Grist · GitHub
Note: the widget cannot be used directly when hosted on GitHub Pages due to iframe restrictions — you will need to host it elsewhere (Netlify works great and is free).
All feedback and suggestions welcome!