Hello everyone ![]()
Sharing a custom widget I’ve been building: Advanced Charts — a free, open‑source
widget that turns any Grist table into a website‑style dashboard you can edit in place,
like a page builder.
Live demo (no install, no Grist needed):
Use it in Grist → add a Custom widget and paste this URL:
https://anupress.github.io/grist-advanced-charts/
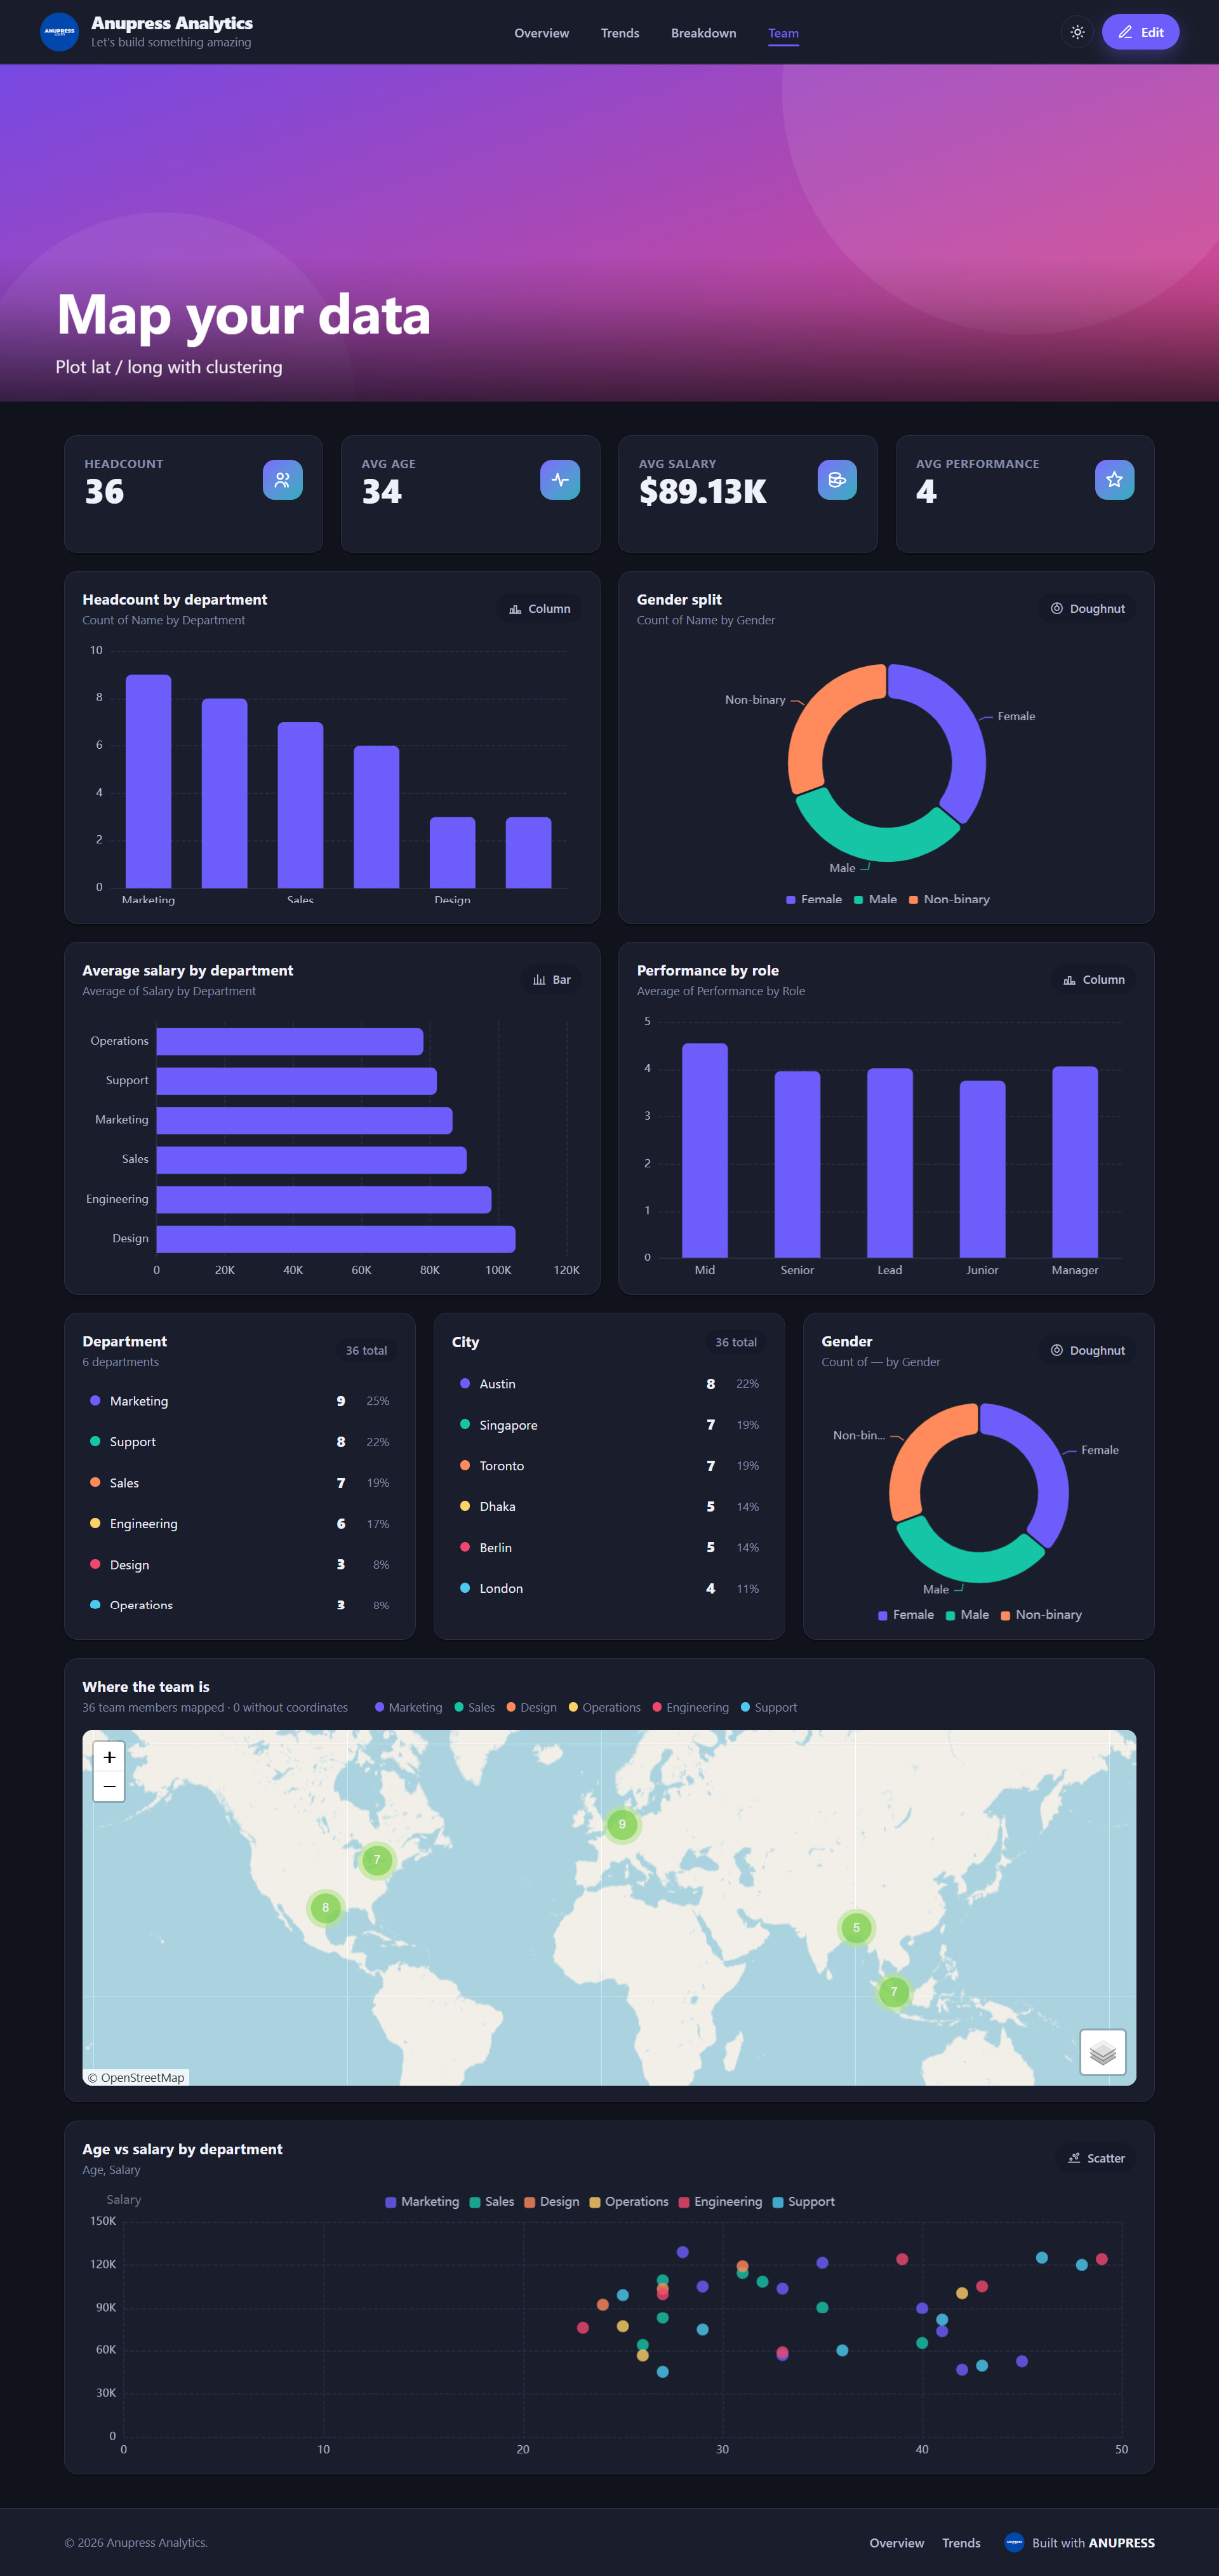
What it does
- Header + tabbed body + footer, switched in‑page (no reload).
- Stat cards (KPI + delta + sparkline), with custom icon uploads.
- Charts — column, bar, line, area, pie, doughnut, treemap, funnel, radar,
scatter, gauge (Apache ECharts). Pick any columns; incompatible types are
greyed and the best one is starred ★. - Breakdown blocks — group‑wise counts with dots/percent, or shown as a
donut/pie/bar/column chart. - Maps — Leaflet with marker clustering, lat/long auto‑detected, up to 4
tooltip fields per pin. - Editable hero / image slider per page (WordPress‑style: alignment,
size, font, colour). - Dark/light with a header toggle, 10 palettes, a global Design
panel (corners, density, width, shadows, text size), and dynamic
subtitles with placeholders (%count,%missing,%groups…).
Privacy
No ANUPRESS server. Everything runs in your browser; data stays in your Grist
document. The widget creates exactly one table — ANUPRESS_Config — to save
your design. Map tiles are the only third‑party request, and only if you add a
map. Delete ANUPRESS_Config and it falls back to the demo.
Repo
What I’d love feedback on
- Anything broken in your Grist? (self‑hosted especially — I’ve only tested on
the hosted service.) - Is the consent + full‑access flow clear enough on the first click of Edit?
- Most‑wanted next chart type (sankey, heatmap, boxplot, candlestick…)?
- Would per‑industry starter templates (Sales / HR / Inventory / Research)
be useful to you?
Thanks for taking a look — happy to answer questions or take PRs.
— Anupress Team