Update: v3.0.0. This one grew a lot since the wizard shipped in 2.0 — the widget has gone from charts on a page to something closer to a page builder that happens to live inside Grist.
22 block types now (up from 5). The ones this forum will probably care about most: a data table with search, click-to-sort and paging; an invoice block that renders a row as a printable document (line items from a linked table, or a single amount column); and a calendar where dragging an event to another day writes the new date back to your table. There are also progress bars, image blocks that read Grist attachments, testimonials, timelines, pricing tables, countdowns, QR codes and a sandboxed HTML embed.
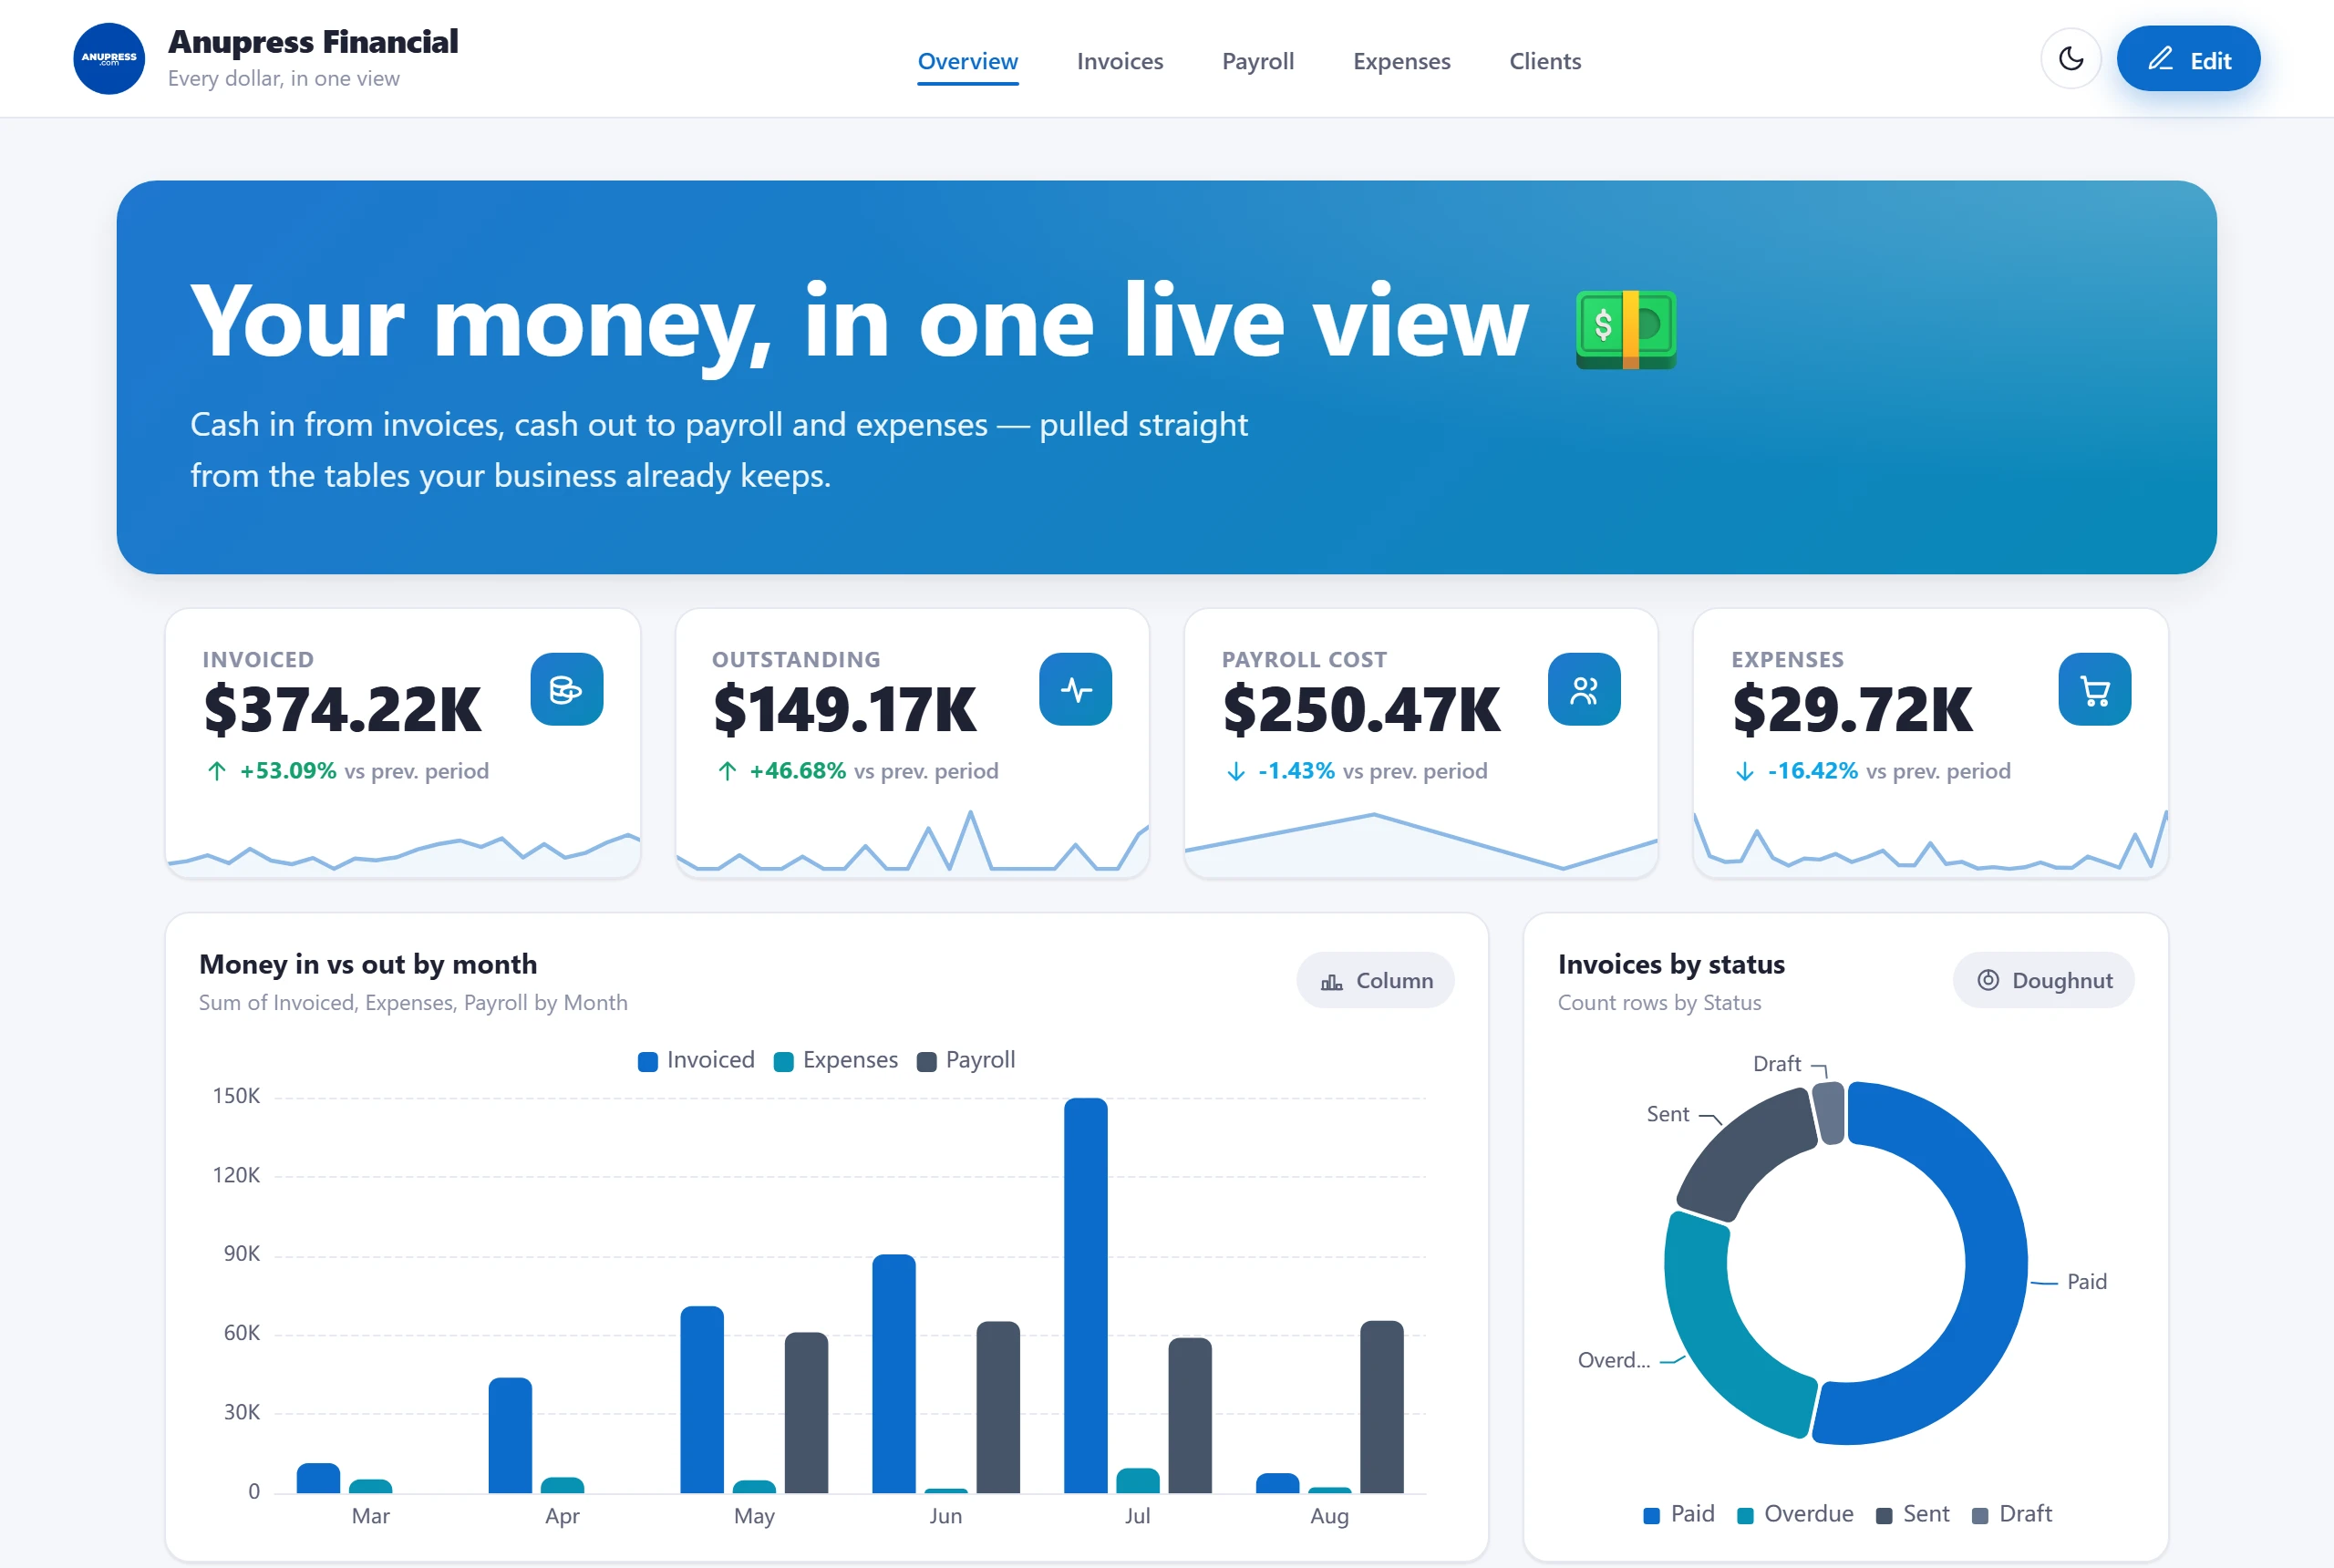
10 starter templates. Each installs a complete multi-page dashboard plus sample tables with real-looking data. Any of its tables can instead be pointed at one of your own — there’s a column-matching step, and it only ever reads from yours. Switching templates offers to clean up the sample tables the widget created earlier; tables you made yourself are never on that list. You can preview them without Grist by URL: finance, research labs, developers — or swap in any of: nonprofits, legal, higher-education, marketing, small-business, sports-facility.
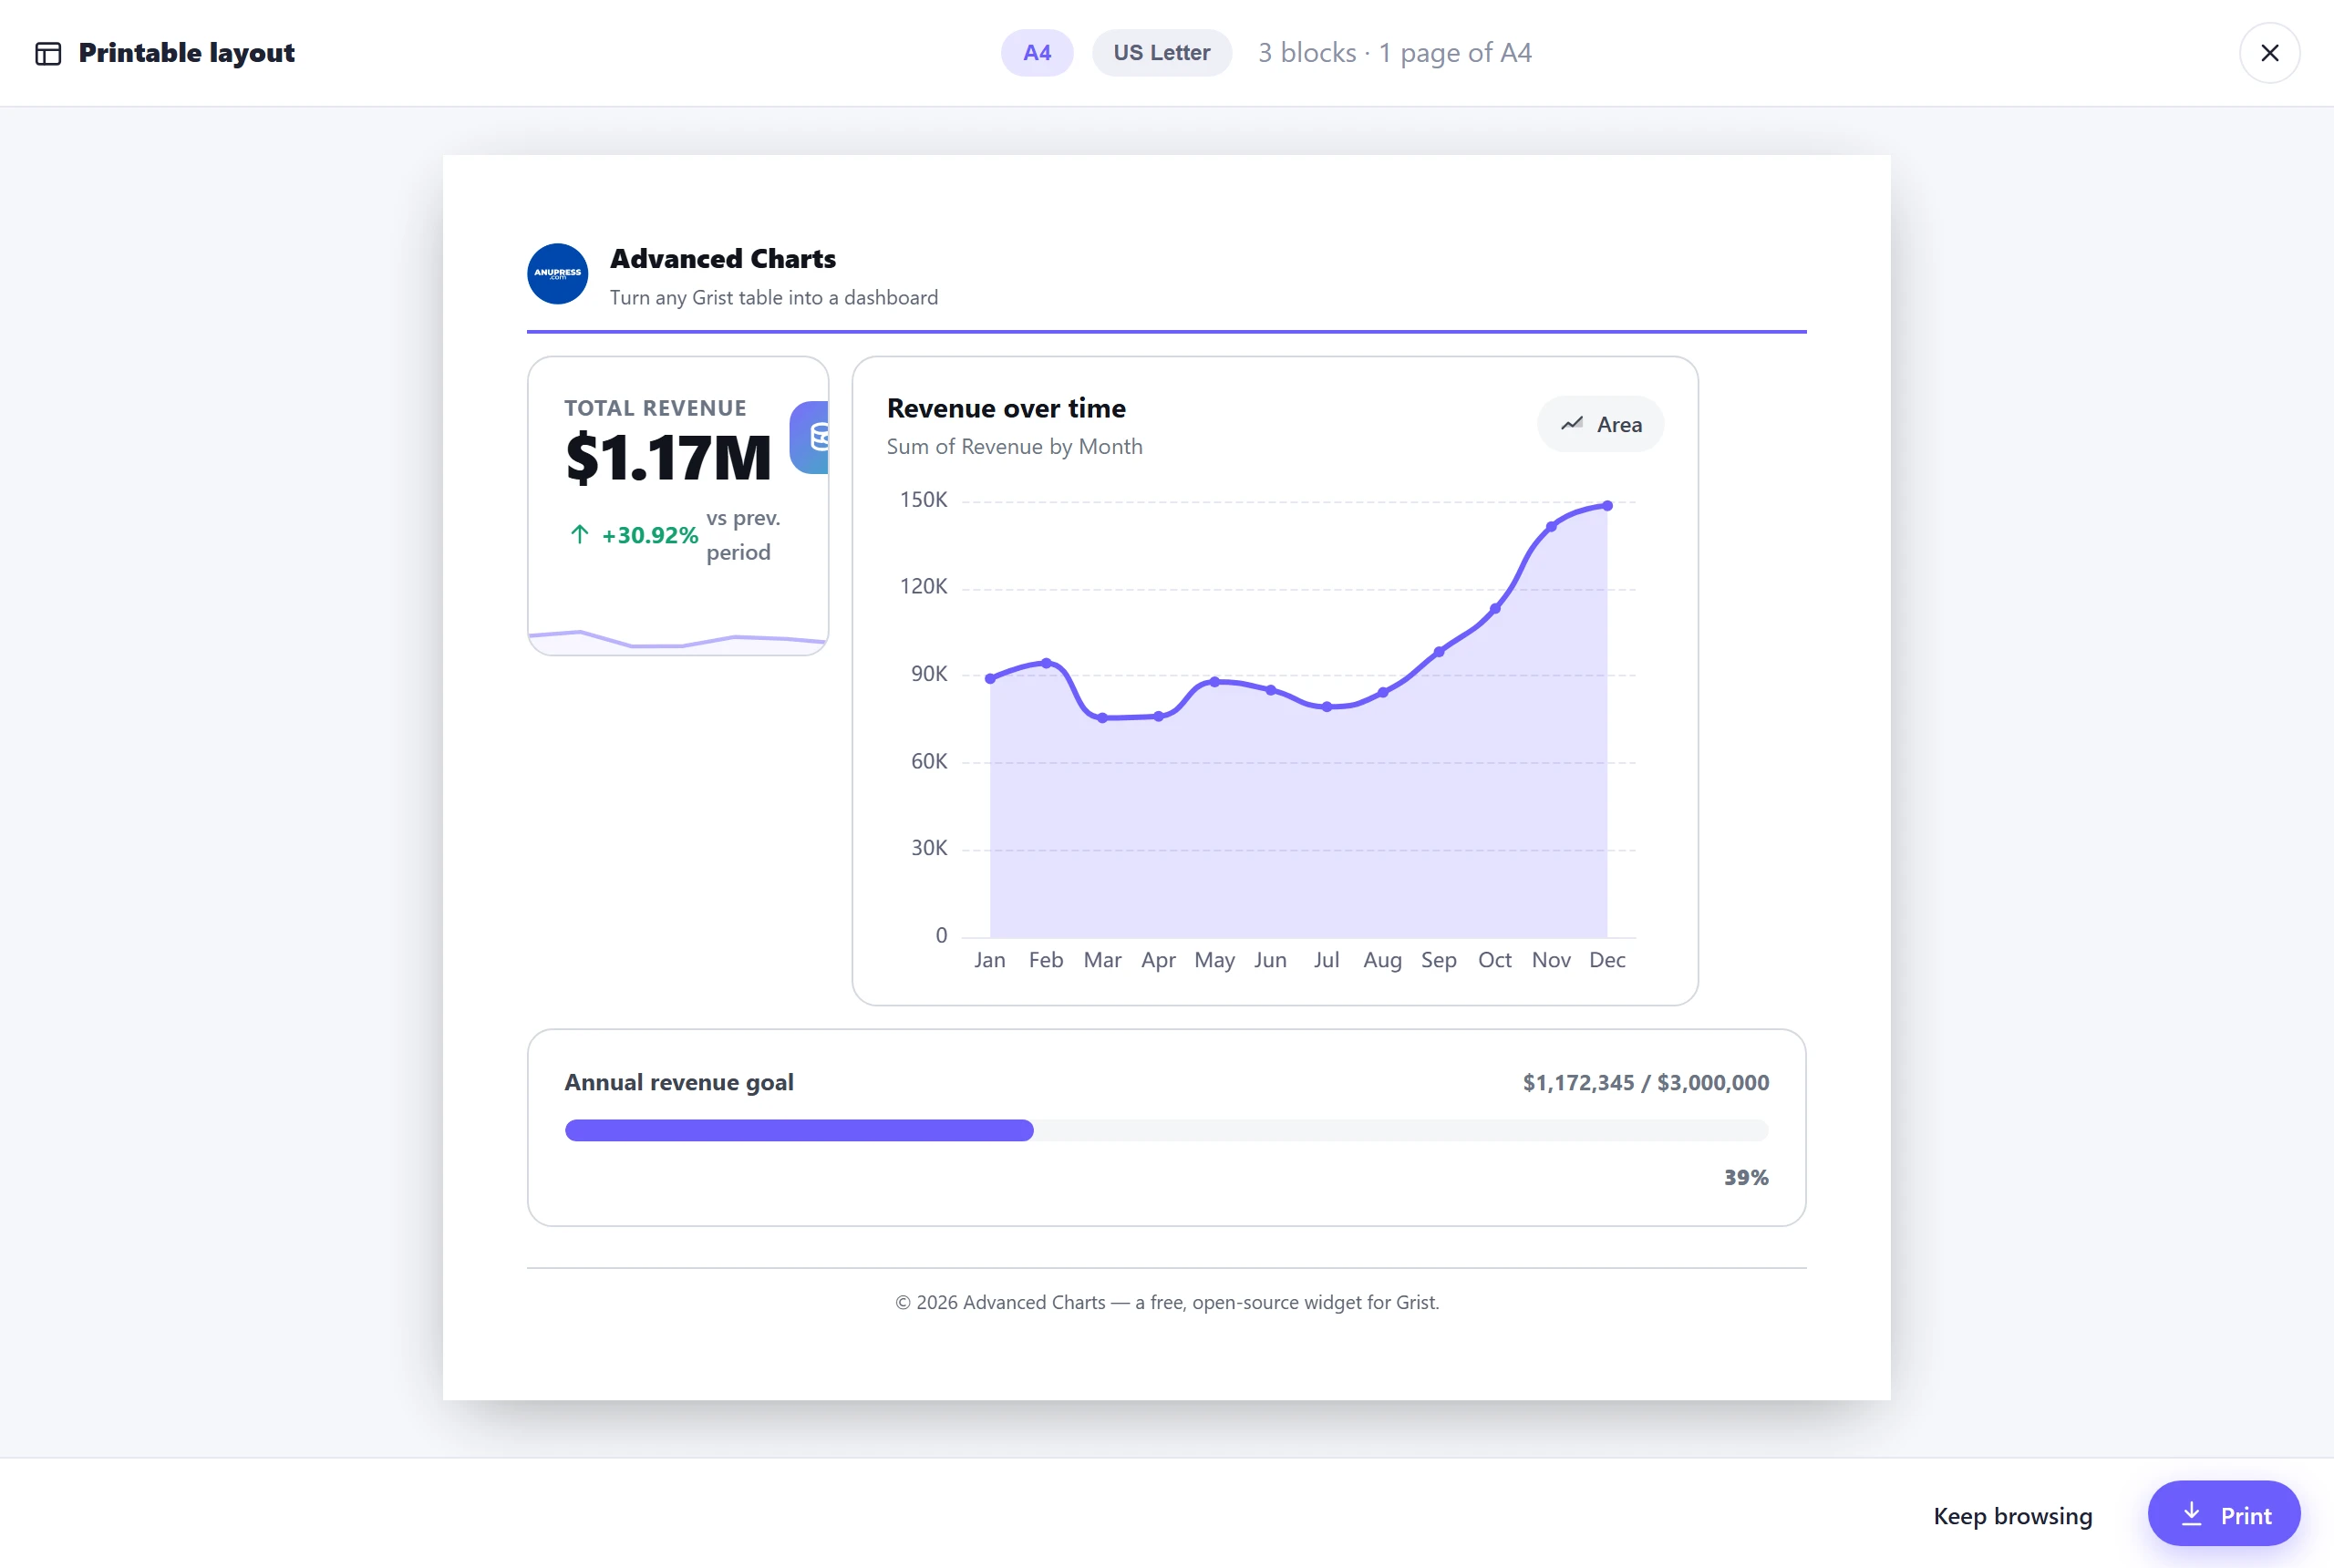
Print and PDF. Every block has an “Add to printout” button in view mode. Collect blocks from any pages, arrange them on an A4 or US Letter sheet with page-break guides that match where the printer will really break, and print or save as PDF. Data tables print as clean reports; an invoice prints alone.
Edit data from the dashboard. On a live document, every data block’s editor has an “Edit the data in …” button: fix a value or add rows, written to Grist as one undoable step. Formula columns show read-only. There’s also a Refresh button that re-reads every table the page uses.
Smaller things worth knowing: 16 palettes and 7 font pairings, a 509-icon searchable library, every control works from the keyboard, and dates are read and written in the column’s own timezone, so nothing drifts a day between regions.
Privacy hasn’t changed: no server, everything runs in the viewer’s browser, and the design saves into your own document.
Demo: Advanced Charts — by ANUPRESS
Docs if you want the long version: the setup guide, a tour of all ten templates, and a block-by-block tutorial. Full changelog is on GitHub.
If your industry is missing from the templates, tell me what tables you keep and I’ll look at building it.