Hi Grist Team ! 
(Every time I’m coming there I’m feeling so happy and grateful !)
Short suggestion for Gantt + TimeLine visualisation tool … 
Hi Grist Team !
(Every time I’m coming there I’m feeling so happy and grateful !)
Short suggestion for Gantt + TimeLine visualisation tool …
The timeline view is also a feature I’m looking forward. Never used the Gantt myself in alternatives.
Well, I guess someone with good coding skills might able to create one as a Custom Widget?
To display a Gantt chart using D3.js, you would need to build the chart from the data. Here’s an example of how you might modify the code to display a Gantt chart:
<!DOCTYPE html>
<html lang="en">
  <head>
    <meta charset="utf-8">
    <title>onRecord</title>
    <script src="https://d3js.org/d3.v6.min.js"></script>
    <script src="https://docs.getgrist.com/grist-plugin-api.js"></script>
  </head>
  <body>
    <div id="gantt-chart"></div>
    <script>
      grist.ready();
      grist.onRecord(function(record) {
        var data = JSON.parse(record.data);

        // Define the dimensions of the chart
        var margin = {top: 20, right: 20, bottom: 20, left: 40},
            width = 960 - margin.left - margin.right,
            height = 500 - margin.top - margin.bottom;

        // Define the scales for the chart
        var x = d3.scaleTime().range([0, width]);
        var y = d3.scaleBand().rangeRound([0, height]).padding(0.1);

        // Define the svg element to render the chart
        var svg = d3.select("#gantt-chart").append("svg")
            .attr("width", width + margin.left + margin.right)
            .attr("height", height + margin.top + margin.bottom)
            .append("g")
            .attr("transform", "translate(" + margin.left + "," + margin.top + ")");

        // Define the y-axis
        y.domain(data.map(function(d) { return d.task; }));
        svg.append("g")
            .attr("class", "y axis")
            .call(d3.axisLeft(y));

        // Define the x-axis
        x.domain([d3.min(data, function(d) { return d.start; }), d3.max(data, function(d) { return d.end; })]);
        svg.append("g")
            .attr("class", "x axis")
            .attr("transform", "translate(0," + height + ")")
            .call(d3.axisBottom(x));

        // Add the bars to the chart
        svg.selectAll(".bar")
            .data(data)
            .enter().append("rect")
            .attr("class", "bar")
            .attr("x", function(d) { return x(d.start); })
            .attr("width", function(d) { return x(d.end) - x(d.start); })
            .attr("y", function(d) { return y(d.task); })
            .attr("height", y.bandwidth());
      });
    </script>
  </body>
</html>
To host the code on Github, you can follow these steps:
I haven´t tested the code. In fact, I never even used Github exactly. The code above and text was done by our friend ChatGPT. I expect some errors initially.
Hello @RogerioPenna ,
I’ll give it a trial when I have a moment and keep you informed.
I’m interesting in integrating D3js, having also possibility to build module for SPC, Cpk and so on (Minitab like). This would need to be able to integrate some math and statistic module. Yet this is not on the top of my priorities ![]()
Thanks.
Hi @Sylvain_Page and @RogerioPenna
how did you go about on this ‘view’ type. I also noticed that Grist currently lacks Kanban view as well. I like the idea of Minitab and SPC and CpK. Seems you are a 6Sigma?
Would like to know more on your experience with Grist.
Thanks
JPeron created a Kanban type of plugin.
Look, I haven´t really ever tested creating a plugin.
And if you read the end of that post with code, you will notice I posted a ChatGPT reply. So I didb´t really go on about creating this “view” type (Custom Widget)
But I gave ChatGPT directions on how to create it.
Thanks @RogerioPenna,
I think @Sylvain_Page may have done some progress on this and more from 6sigma perspective.
On a side note, do you any experience on creating frontend apps using a frontend / portal builder for Grist, something how Softr is for Airtable?
Thanks
Can you give a more precise example?
What I have done is to embed Grist pages in both embed and single page modes ( Embedding - Grist Help Center ) inside our Wiki portal.
So I created department pages that list documents from that department in tabs, but other tabs have iframes showing Risks Register of those department in Grist, as well as Process Indicators and KPIs in Grist also showing inside the Wiki page.
We are also going to test including forms and iframes of the Grist Client’s Complaint app inside our main business processes website.
Thanks for your quick reply @Rogerio_Penna
What i meant by creating frontend apps… is that more flexibility in the interface design / layout / UI along with User Workflow (with user role permissions). Something like this https://devpost.com/software/airlearn?ref=blog.airtable.com as an app example.
And something what Softr does Build a Customized Airtable Front-End [+ Examples]
Thanks
while I don´t think you can use Grist as simple a database and a frontend like you showed to run it, Grist from the box already has more options of displaying stuff than Airtable as far as I know.
I mean, you can assemble views/pages with several different widgets, plus you can have html columns that can be read by the HTML widget and show complex reports, etc,
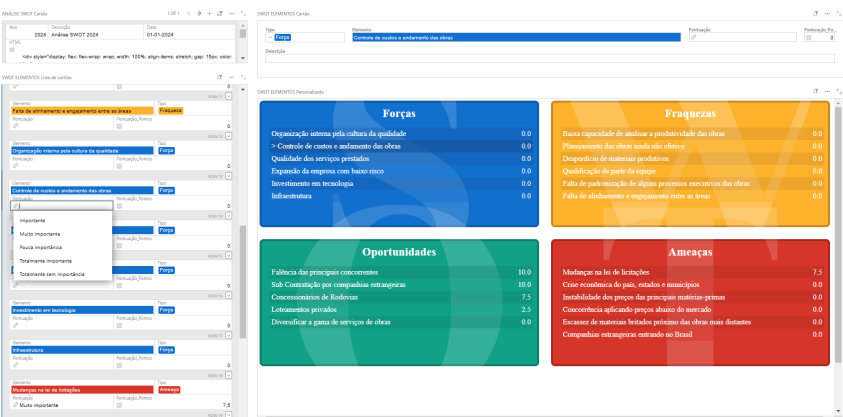
for example, check the SWOT Analysis app I did at Grist
Hi there!
Think the kanban developped by @jperon is nice enough for me. @Rogerio_Penna showed nice examples and I haven’t much things to add to this. Honestly speaking I’m not a huge fan of Kanban I prefer TimeLine and todo list but that’s another topic.
Currently, I’m managing NC issues (kind of like 8D, but simplified for easier tracking) and handling more operational tasks due to recent staffing issues.
I’m using a lot of my previous Grist tools for these tasks, but I still find myself relying on Excel and Minitab for the areas where Grist falls short, particularly in statistical process management and SPC charts. For repetitive tasks, I’m using Jupyter notebooks, but the one included in Grist is too slow to start up, so I have a separate instance running on our server.
One of my concern right now is effectively measuring and analyzing process data, ensuring the data is safe, coherent, and easily retrievable, and then using that data to improve parts production and développement. Creating personnal dataset would be perfect but needs to much effort for our small company.
So I’m especially focused on advanced statistical analysis and process control, but I find that Grist lacks certain features that I need, like a comprehensive Six Sigma template with clean process analytics.
Given these needs, I’m considering developing a Minitab-like tool within Grist. While the latest advanced chart widget in Grist has given me more tools for tracking data analysis, a full Six Sigma solution would still require significant frontend development. I’ve thought about using a markdown template, but it doesn’t integrate graphs well. So, it might be simpler to develop the entire frontend in JavaScript while keeping the data stored in Grist.
However, a key concern with developing custom tools is ensuring the reliability of calculations, especially since the automotive industry demands proven and standardized methods. If you’ve ever worked with MSA, ANOVA, or VDA5, you know that customers typically won’t want to verify your calculations themselves due to lack of time, knowledge, or effort, which presents another challenge.
As said previously I’m short on développement time thoses weeks so it remains a project I haven’t investigated deeper (and also because javascript script lacks python readability).
Sorry for the long thread—I’m on holiday ![]() and typing on my smartphone.
and typing on my smartphone.
Have a nice day.
Thanks to the GREAT grist-core team (thanks thanks), LONG LIFE TO GRIST, candles to GRIST COMMUNITY, special thanks to @jperon and ants teams.
@Rogerio_Penna I agree with you but the disadvantage in Grist is that when you create a new ‘Page’ , its not a webpage where you can add any layout or design. Its still attached to a ‘table’ or multiple ‘tables’ so the limitation of ‘page’ is there and unless this is extendible to create any layout or interface then i’m missing on that.
@Sylvain_Page I would love to know more on what you have created and your next plans on this. Let me know if we can connect over whatsapp
I agree with you but the disadvantage in Grist is that when you create a new ‘Page’ , its not a webpage where you can add any layout or design
And why not use a webpage with an iframe to Grist?
iframe is good for small tweaks but to create a good interface design / layout / UI along with User Workflow (with user role permissions), like this https://devpost.com/software/airlearn?ref=blog.airtable.com is going to a be a challenge.
I think we definitely need something like what Softr does for Airtable with these features (Build a Customized Airtable Front-End [+ Examples])
Well, you are talking about a very specific software, that uses Airtable as a database.
But then, are you sure you can´t use Grist database as a source for SoftR?
Or are you saying you want Grist to natively do what SoftR does?
Hi @Rogerio_Penna
I agree this could be a specific use case and I have not so far used Softr for Grist.
But what I’m trying to state is that we should have a ‘page’ builder which can work seamless across Grist datatables like that done in my above 2 links.
Please dont take me wrong… Grist is great but can be made even better.
Can we make Grist to natively do what Softr does? Is this possible with some hacks?
That looks great! I’ve been wanting to do something similar but that looks sleek. Mind to share what widgets you’ve used? A lot of custom work maybe?