Table A:
In table B, i want to, for each column insight-1…N, create a new table:
| Insight |
sum-true |
sum-false |
sum-none |
| insight-1 |
1 |
1 |
0 |
| insight-2 |
0 |
1 |
1 |
And i’m not understanding the construct here.
COUNT(table1.lookupRecords(insight-1=$VALUE)) doesn’t seem to do what i thought.
Can anyone point me in the correct direction?
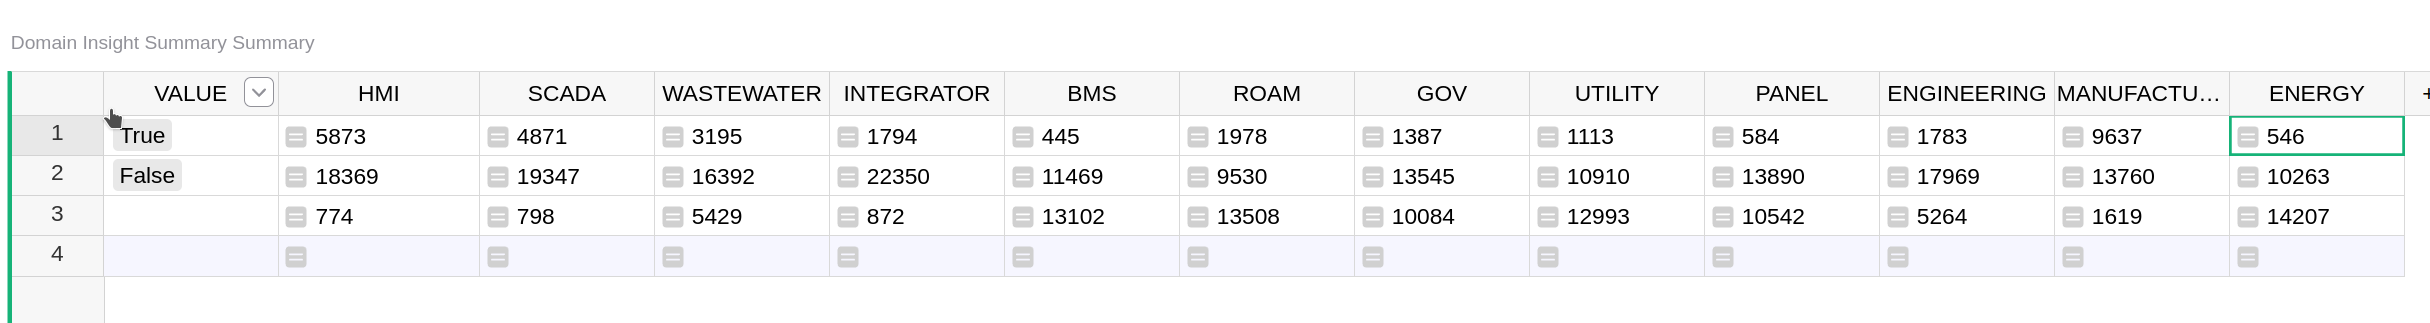
It would be easier to produce the transposed table:
| Value |
insight-1 |
insight-2 |
| True |
1 |
0 |
| False |
1 |
1 |
| None |
0 |
1 |
If your table B has those 3 rows with Value, then the formulas would be:
- For
insight-1: len(TableA.lookupRecords(insight_1=$Value))
- For
insight-2: len(TableA.lookupRecords(insight_2=$Value))
The reason the other arrangement is difficult is that rows and columns are not interchangeable in Grist. For instance, formulas are always applied to a column.
Thank you for that idea. But from here i’m not sure how to make a stack graph using the data. e.g. all would sum to the same value, but show the ratio of true/false/none.
Ooh, this is unfortunately difficult, but possible with a trick. Would you mind making a public document with some sample data with your structure, and sharing it (view-only is fine)? I can then add the trick in a copy and share back. It’s hard to explain, and easier to show, hence the request.
BTW, the straightforward (“as intended” in Grist) way of doing it would be to merge all the many columns with the same kind of data into one, with rows like:
This is more database-like and makes it easier to summarize and make charts, but with this, you wouldn’t get to see or enter your data in a matrix view.