We have a document with orders, date of order, SKU, and the quantity of each SKU per order. We can easily create a summary table that shows the total number bought of each SKU over all the orders from all dates. But, we are wondering, how can we create a summary table that says, find me the amount of SKU’s that were ordered over a specific timeframe, say September 1, to September 30. So the summary table would only show the total count of SKU for those days. Is this possible?
Hi there,
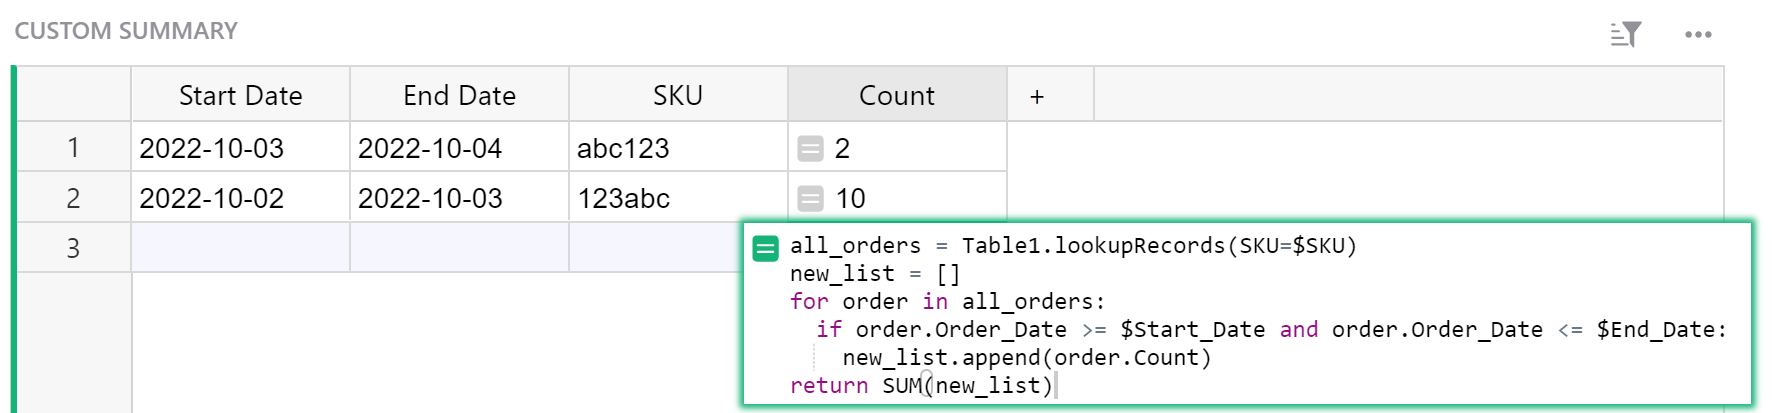
There is no built in way to do this but it would be a cool feature! This is currently possible with a formula. I created an example with a “custom summary” table. You enter the Start Date and End Date for your time frame then enter the SKU you wish to find the total count for. The formula column will use this data to find the total number of that item ordered within that time frame.
https://public.getgrist.com/bobFL3Qu43ki/Community-1538/m/fork
The formula used in the Count column of the Custom Summary table is:
all_orders = Table1.lookupRecords(SKU=$SKU)
new_list = []
for order in all_orders:
  if order.Order_Date >= $Start_Date and order.Order_Date <= $End_Date:
    new_list.append(order.Count)
return SUM(new_list)
First, we find all records in Table 1 where the SKU matches the SKU in this row. We assign this list of records to the variable all_orders. Next, we create an empty list assigned to the variable new_list.
Then, we iterate through our list of orders in all_orders (where SKUs match). If the Order Date for an order in the list falls between (or on) the Start Date and End Date specified, we add the Count associated with that order to the list assigned to the variable new_list.
After iterating through each order, the formula returns the sum of the Count value for all orders where SKU matches the SKU specified in this column and the Order Date falls on or between the specified start and end date.
I hope this helps! Please let me know if you have any questions.
Thanks,
Natalie
Thanks! That formula is very helpful and actually I was looking for something similar. My question, though is: Since you can mimic a summary table with some basic python programming (looping over data with lookupRecords), is the only purpose of the built-in summary tables Grist to just make that process easier without any code? I mean you can easily program your own summary tables by just basically using the code above, and so in that case, is there any benefit in using the Summary tables. Personally, I find the built in summary table a bit confusing for some types of data.
That’s correct, Grist users can create a summary table without needing to learn any complicated formulas. The Summary tables’ uniqueness is in automatically creating rows for all of the combinations of group-by column values. Once you have records grouped, you can use simple formulas to get quite a bit of information for those groups. For those instances when a summary table does not fit your needs, you can create your own using Python formulas. The entire Python standard library is available to you to use in formulas. Keep in mind that if you have a large amount of data and have a formula column containing a complicated formula, it will take time to complete those calculations so you could see some lag.