Hello,
I have a table (A) which contains a field “Start_Date” and a field “End_Date”. I want another table (B) to show individual records for every individual day between “Start_Date” and “End_Date”. How can I do that?
Thank you for your help!
Hello,
I would like to see more information on your data setup, because as the question stands, I have to make many assumptions. I will assume your TableA is your summary table, and tableB is your detailed records.
And from that, I am going to assume that TableB simply has a “Date” column (something like effective date or birthdate, instead of “StartDate” for an effective date and “EndDate” for an expiration date).
Many ways to accomplish this:
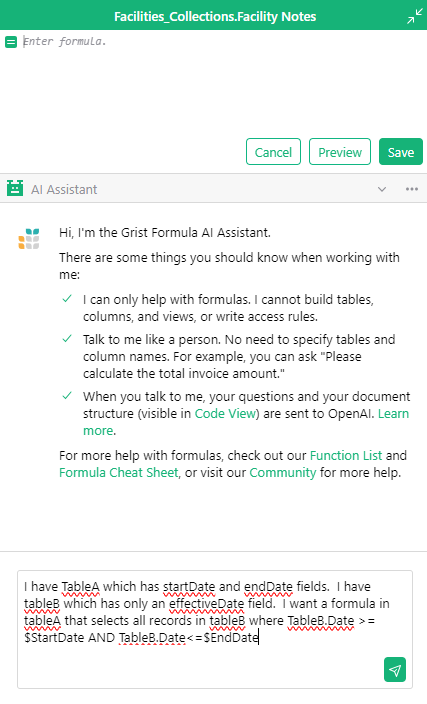
1. Create your own summary table by creating TableA as you describe, and then creating a reference formula in tableA that selects all records in tableB where TableB.Date >= $StartDate AND TableB.Date<=$EndDate
-
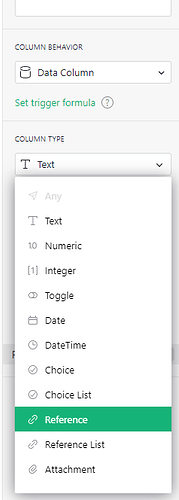
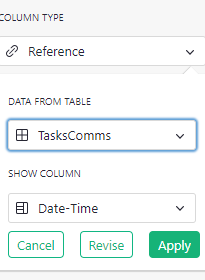
A. Create a field / column of the type “reference” (maybe name it something like matchedRecs)
~ ~ →
-
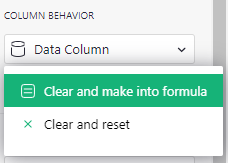
B. **Make the column behavior a “formula”
-
C. If you need help building formulas, use the AI builder
→ step one, make the column a reference field.
→ step two, make the column a formula
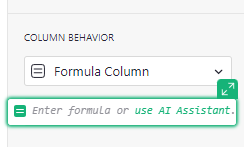
→ step three, if you don’t know how to build a reference formula, ask the formula builder.
→
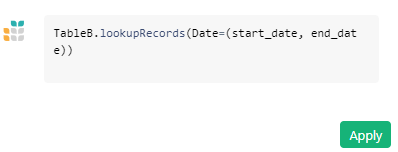
-
D. Insert a widget, with TableA being youre “select by” table. If you need, specify “TableA.matchedRecs”
- Use the summary table builder: Summary tables - Grist Help Center.
