Here is the line chart showing serie A
and here serie B
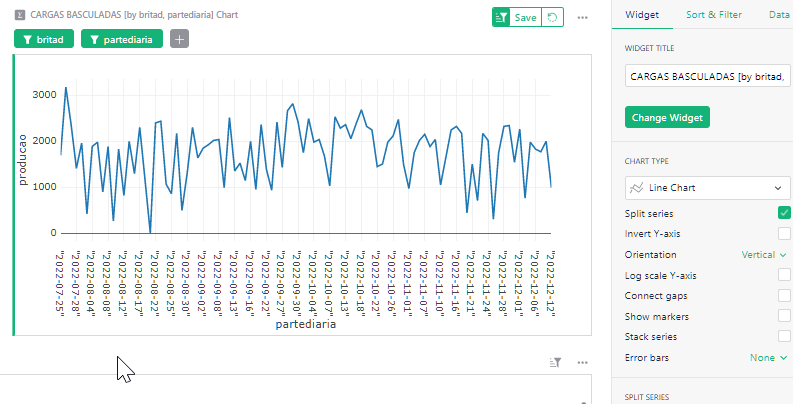
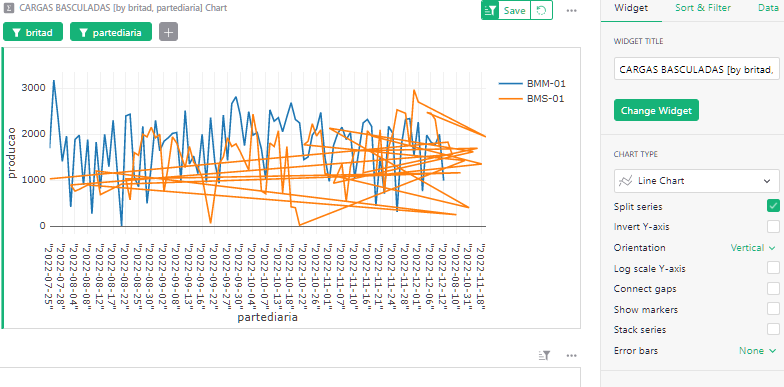
But then, when I remove the filters and show both… wtf
Here is the line chart showing serie A
and here serie B
But then, when I remove the filters and show both… wtf
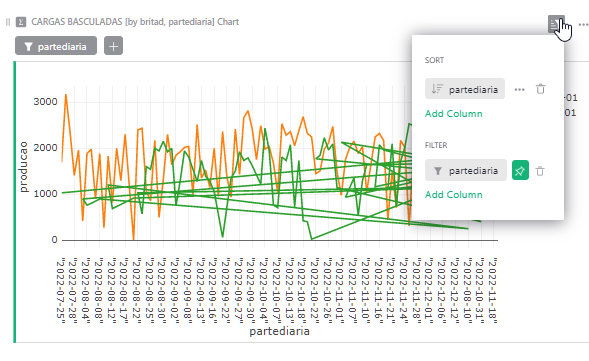
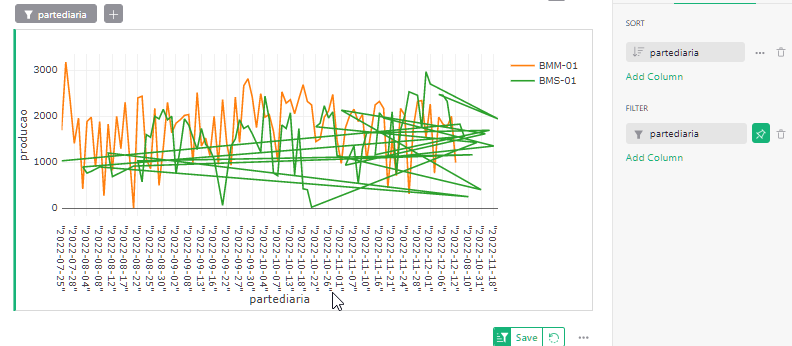
Eek, admittedly, it looks terrible! Try going into the “Sort & Filter” tab of the Creator Panel, and sorting by the column partediaria. If that fixes it, remember to Save that sort setting.
For this chart type, the points being plotted should really be sorted automatically, but it looks like they are not, which is why the line is connecting points all out of order, and it looks like a mess.
I’m sorry, it looks like my explanation was off, and there is indeed a bug.
If you can use a column of type Date for the values, or can get rid of the quote marks around your dates, then the graphing library will interpret the X-values as dates, and will show them sorted properly.
When the values are text, and with Split Series, it looks like there is a genuine bug. I can reproduce it.
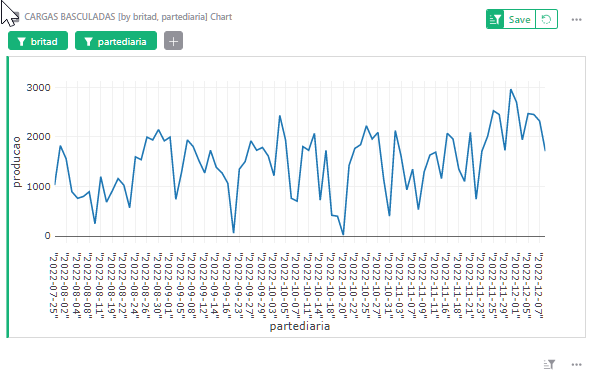
Ok. I solved it. The problem is that column with Date in text format was coming from the another system where the date was the ID.
At Grist, I transformed another column in a reference, and used the Date from the other table as ID, so it LOOKED THE SAME as the old ID, however, the reference was set as type ANY, so while it SHOWED date, it was using I guess the real ID of the other table (or maybe the date in number format) when creating the graph, resulting in an even more nonsensical chart. But when I changed the reference to DATE format, it worked.
Not sure I should open a new thread… but is there anyway to aggregate those date/times by month of X year?
It’s easy to discover the month of a date… but I want to aggregate all values of January 22, not January 20+ January 21 + January 22…
Tried to get month and year, then concatenate both and show result as date, but it didn´t work.
Yes! The first step is to ensure your date column (“partediaria”) has the column type of Date. It sounds like you already have that. Now, add a formula column “Month” with the formula:
$partediaria.strftime("%Y-%m")
You can then choose this column for the X-axis.
There is a bit more in this post (e.g. if you’d like to go by quarters rather than months):
https://community.getgrist.com/t/recipe-for-getting-months-and-quarters-from-dates/111