Hi!
Please, how do I show (increase the size shown) of the Y-Axis?
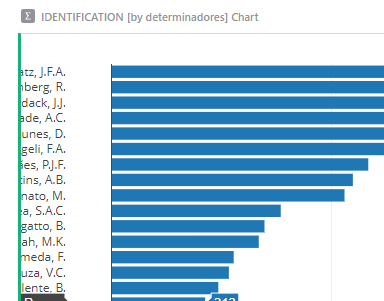
Thank in advance!
Eduardo
Hi!
Please, how do I show (increase the size shown) of the Y-Axis?
Thank in advance!
Eduardo
Sorry, this is a bug. There isn’t an option to set a width for the Y-Axis labels, but the normal behavior should be to give it enough space to fit all the text of the labels. We will prioritize a fix.
If the space for the Y-Axis labels is auto-expanded, would that be enough, or do think you would still need an option to set width manually?
Hi Dmitry!
Thank you for let me know.
In my humble opinion, and if you allow me to be nosy, the charts are one of the weakest features on GRIST. Despite it is a very helpful for quick insights, my routine is to use alternatives outside GRIST.
Communicate is important and, despite GRIST is a wonderful tool to “massage” the data, it has limitations to communicate with data (visualize) and also limitations to communicate with other tools (API) that will use the data on GRIST to better communicate.
In my wonderful, magical and utopian world, where I have a unicorn farm, GRIST would have plugins that could be installed, for instance, https://www.chartjs.org (or one of those other: Comparison of JavaScript charting libraries - Wikipedia), that could extend this magnificent tool, “to infinity and beyond”.
In this world, I would have also a “GRIST Studio”, where all my “raw” data would be in an “SPA”, to be beautified and get meaning.
I do understand how difficult it is to handle with the expectations of users and keep this complex tool working smoothly. However, I hope you consider this a “constructive criticism”. I’m a big fan of GRIST, and it’s enthusiastic and kind staff! 
And finally replying your question, Yes, it would be great to have more control over the charts.
Thanks!
Thanks for this feedback, Eduardo. I agree there’s a lot more to do with charts and look forward to getting to that project when we do.
The newly announced Advanced Charts custom widget has much more power and flexibility which should solve most of your charting needs. You can control many of the details of the styling including the exact margins of the axes.
Having said that, this particular problem was solved a while ago for normal Grist charts, i.e. the margins are automatically adjusted. I’ve also made sure that the new advanced charts do the same by default.