Obviously not. 
Some stuff work directly. Some stuff work better now with the “self analyzing” o1 Preview and o1 Mini models, rather than GPT 4o.
Often there will be several trial and errors due to things that Grist does differently than standard Python.
Giving examples of formulas, asking what it does, and then telling it to change the formula to do that and that with table X and Y and columns A, B and C will work much better than just telling it to just do something.
If I WAS a coder, I would probably not have the patience to correct ChatGPT multiple times. That said, a programmer might be able to spot errors, correct them himself or tell ChatGPT what to correct, and leave all that code to ChatGPT, accelerating it.
For me, despite all the work correcting and re-correcting (just by saying what is wrong, etc, very few times I spot directly the programming error) it’s simply the difference between DOING it and NOT doing it, because I wouldn´t be able to do it without the tool. Simple as that.
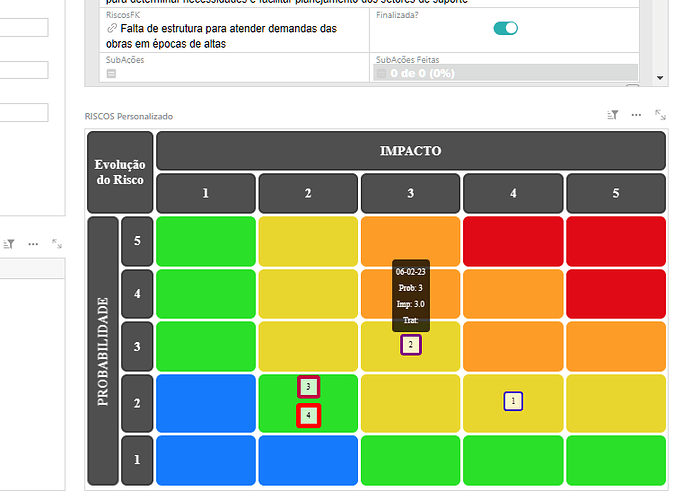
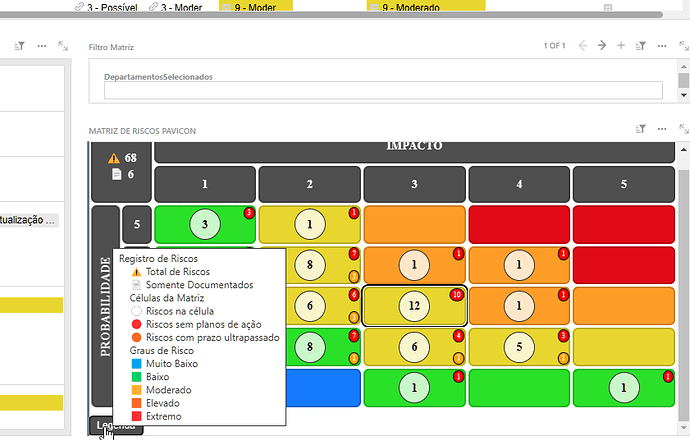
But still… look at the Risk Matrix code… it was all ChatGPT created
def gerar_matriz_riscos():
from datetime import datetime
# Obter os departamentos selecionados
departamentos_selecionados = rec.DepartamentosSelecionados or []
# Obter o risco selecionado (rec)
risco_selecionado = rec # 'rec' é o risco atual na tabela de Riscos
# Obter a probabilidade e impacto atuais do risco selecionado
analises_sel = Analise_Risco.lookupRecords(RiscoFK=risco_selecionado.id, sort_by="Data_Analise")
impacto_atual_sel = analises_sel[-1].ImpactNum if analises_sel else risco_selecionado.Impacto_Inerente_Num
probabilidade_atual_sel = analises_sel[-1].ProbNum if analises_sel else risco_selecionado.Probabilidade_Inerente_Num
chave_selecionada = (int(probabilidade_atual_sel), int(impacto_atual_sel))
# Coletar todos os riscos
todos_riscos = Riscos.all
# Dicionários para armazenar os contadores e riscos por célula
contagem_matriz = {}
riscos_por_celula = {}
# Identificar riscos que possuem planos de ação
planos_de_acoes = Planos_de_Acoes.all
riscos_com_planos = set()
for risco_fk in planos_de_acoes.RiscosFK:
if risco_fk:
riscos_com_planos.add(risco_fk.id)
data_atual = datetime.now().date()
ultrapassados_por_celula = {}
sem_planos_por_celula = {}
total_riscos = 0
riscos_documentados = 0
for risco in todos_riscos:
# Filtrar os riscos pelos departamentos selecionados
if departamentos_selecionados:
if risco.Departamento not in departamentos_selecionados:
continue
# Obter as análises de risco ordenadas por data
analises = Analise_Risco.lookupRecords(RiscoFK=risco.id, sort_by="Data_Analise")
impacto_atual = analises[-1].ImpactNum if analises else risco.Impacto_Inerente_Num
probabilidade_atual = analises[-1].ProbNum if analises else risco.Probabilidade_Inerente_Num
total_riscos += 1
# Ignorar riscos com impacto ou probabilidade zero
if impacto_atual == 0 or probabilidade_atual == 0:
riscos_documentados += 1
continue
impacto_idx = int(impacto_atual)
probabilidade_idx = int(probabilidade_atual)
chave = (probabilidade_idx, impacto_idx)
contagem_matriz[chave] = contagem_matriz.get(chave, 0) + 1
riscos_por_celula.setdefault(chave, []).append(risco)
if risco.id not in riscos_com_planos:
sem_planos_por_celula[chave] = sem_planos_por_celula.get(chave, 0) + 1
# Verificar se a próxima análise está ultrapassada
if analises:
ultima_analise = analises[-1]
data_proxima = ultima_analise.Data_Proxima_Analise
if data_proxima and data_proxima < data_atual:
ultrapassados_por_celula[chave] = ultrapassados_por_celula.get(chave, 0) + 1
def obter_cor_risco(risk_score):
if risk_score == 0:
return ('#d3d3d3', 'Inexistente')
elif risk_score <= 2:
return ('#157AFB', 'Muito Baixo')
elif risk_score <= 5:
return ('#2AE028', 'Baixo')
elif risk_score <= 10:
return ('#E8D62F', 'Moderado')
elif risk_score <= 16:
return ('#FD9D28', 'Elevado')
else:
return ('#E00A17', 'Extremo')
max_valor = 5
html = """
<table style="border-collapse: separate; border-spacing: 2px; width: 100%; height: 100%; table-layout: fixed;">
<tr>
<th rowspan="2" colspan="2" style="background-color: #4f4f4f; width: 80px; height: 100px; border: 1px solid white;
border-radius: 8px; box-shadow: inset 0 0 0 2px #3d3d3d; color: white; text-align: center; vertical-align: middle;">
<div>⚠️ {total_riscos}</div>
<div>📄 {riscos_documentados}</div>
</th>
<th colspan="5" style="background-color: #4f4f4f; color: white; text-align: center;
border: 1px solid white; border-radius: 8px; box-shadow: inset 0 0 0 2px #3d3d3d;">IMPACTO</th>
</tr>
""".format(total_riscos=total_riscos, riscos_documentados=riscos_documentados)
html += '<tr>'
for prob in range(1, max_valor + 1):
html += f'<th style="background-color: #4f4f4f; color: white; text-align: center; width: 80px; \
border: 1px solid white; border-radius: 8px; box-shadow: inset 0 0 0 2px #3d3d3d;">{prob}</th>'
html += '</tr>'
for i in range(max_valor, 0, -1):
if i == max_valor:
html += '<tr>'
html += '<th rowspan="5" style="background-color: #4f4f4f; color: white; text-align: center; vertical-align: middle; \
writing-mode: vertical-rl; transform: rotate(180deg); border: 1px solid white; border-radius: 8px; \
box-shadow: inset 0 0 0 2px #3d3d3d;">PROBABILIDADE</th>'
html += f'<th style="background-color: #4f4f4f; color: white; text-align: center; width: 40px; \
border: 1px solid white; border-radius: 8px; box-shadow: inset 0 0 0 2px #3d3d3d;">{i}</th>'
for prob in range(1, max_valor + 1):
chave = (prob, i)
count = contagem_matriz.get(chave, 0)
risk_score = prob * i
cor_celula, nivel_risco = obter_cor_risco(risk_score)
def escurecer_cor(cor):
cor_rgb = tuple(int(cor.lstrip('#')[j:j+2], 16) for j in (0, 2, 4))
cor_rgb_escura = tuple(max(int(c * 0.8), 0) for c in cor_rgb)
return f'rgb{cor_rgb_escura}'
cor_borda = escurecer_cor(cor_celula)
# Verificar se a célula é a selecionada
is_selected_cell = (chave_selecionada == chave)
cell_style = f'background-color: {cor_celula}; border-radius: 8px; box-shadow: inset 0 0 0 2px {cor_borda}; \
border: 1px solid white; position: relative; height: 50px;'
if is_selected_cell:
cell_style += ' outline: 3px solid black;'
riscos_na_celula = riscos_por_celula.get(chave, [])
if riscos_na_celula:
tooltip_lines = []
# Agrupar riscos por departamento
riscos_por_departamento = {}
for r in riscos_na_celula:
dept = r.Departamento.Departamento.upper() if r.Departamento else "SEM DEPARTAMENTO"
riscos_por_departamento.setdefault(dept, []).append(r)
# Ordenar departamentos
for dept in sorted(riscos_por_departamento):
if tooltip_lines:
tooltip_lines.append("") # Adiciona uma linha em branco entre os departamentos
tooltip_lines.append(f"🔶 {dept}")
# Ordenar riscos dentro do departamento
for r in sorted(riscos_por_departamento[dept], key=lambda x: x.NomeRisco):
codigo_risco = "RSK-{:0>4}".format(r.id)
tooltip_lines.append(f" {codigo_risco} : {r.NomeRisco}")
tooltip_text = '
'.join(tooltip_lines)
else:
tooltip_text = "Nenhum risco nesta célula"
tooltip_text = tooltip_text.replace('"', '"')
sem_planos = sem_planos_por_celula.get(chave, 0)
ultrapassados = ultrapassados_por_celula.get(chave, 0)
html += f'<td style="{cell_style}" title="{tooltip_text}">'
html += '<div style="width: 100%; height: 100%; display: flex; align-items: center; justify-content: center;">'
if count > 0:
html += f'<div style="background-color: rgba(255, 255, 255, 0.75); border: 2px solid #333; \
border-radius: 50%; width: 40px; height: 40px; display: flex; align-items: center; justify-content: center; \
font-weight: bold; font-size: 16px;">{count}</div>'
else:
html += ' '
html += '</div>'
if sem_planos > 0:
html += f'''
<div style="
position: absolute;
top: 2px;
right: 2px;
background-color: #FF0000;
color: white;
font-size: 10px;
padding: 2px 4px;
border-radius: 50%;
pointer-events: none;
border: 1px solid black;">
{sem_planos}
</div>
'''
if ultrapassados > 0:
html += f'''
<div style="
position: absolute;
bottom: 2px;
right: 2px;
background-color: #FFA500;
color: white;
font-size: 10px;
padding: 2px 4px;
border-radius: 50%;
pointer-events: none;
border: 1px solid black;">
{ultrapassados}
</div>
'''
html += '</td>'
html += '</tr>'
html += '</table>'
# Botão Legenda com Tooltip
html += """
<div style="margin-top: 10px; display: inline-block;">
<button style="padding: 5px 10px; border: none; background-color: #4f4f4f; color: white; border-radius: 5px; cursor: pointer;" title="Registro de Riscos
⚠️ Total de Riscos
📄 Somente Documentados
Células da Matriz
⚪ Riscos na célula
🔴 Riscos sem planos de ação
🟠 Riscos com prazo ultrapassado
Graus de Risco
🟦 Muito Baixo
🟩 Baixo
🟨 Moderado
🟧 Elevado
🟥 Extremo">
Legenda
</button>
</div>
"""
return html
# Chamada da função para gerar a matriz
return gerar_matriz_riscos()


