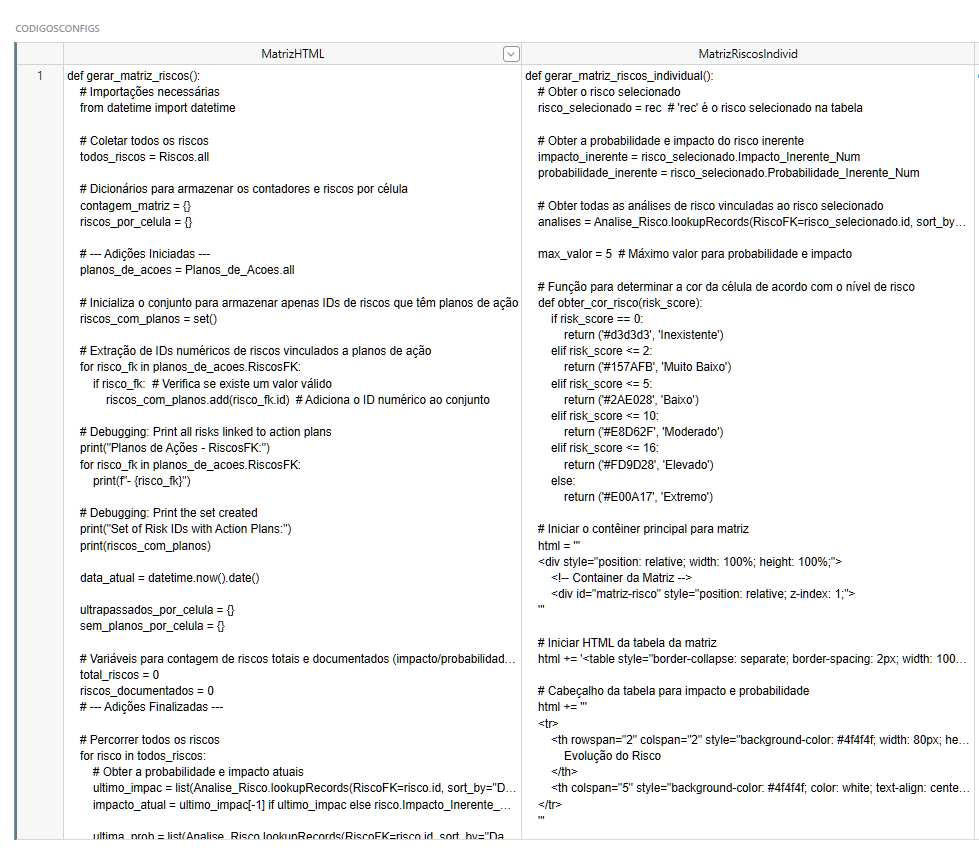
I have a big formula creating a Risks Matrix.
If I have the risk matrix table with 150 records, it will repeat that big formula 150 times.
Is there a way to improve that, like having a table for formulas and referencing the formula you want in the Risk Table?
so each record instead of having a 14 thousand characters formula, will have a 100 characters formula retrieving the whole code from another table?
BiBo
September 17, 2024, 9:02pm
2
it is not working with my formula, maybe due to complexity, values being pulled from everywhere
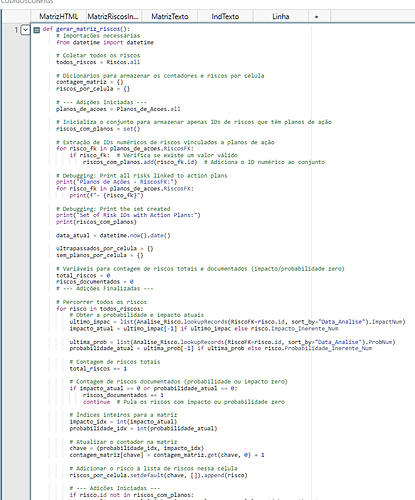
def gerar_matriz_riscos():
# Importações necessárias
from datetime import datetime
# Coletar todos os riscos
todos_riscos = Riscos.all
# Dicionários para armazenar os contadores e riscos por célula
contagem_matriz = {}
riscos_por_celula = {}
# --- Adições Iniciadas ---
planos_de_acoes = Planos_de_Acoes.all
# Inicializa o conjunto para armazenar apenas IDs de riscos que têm planos de ação
riscos_com_planos = set()
# Extração de IDs numéricos de riscos vinculados a planos de ação
for risco_fk in planos_de_acoes.RiscosFK:
if risco_fk: # Verifica se existe um valor válido
riscos_com_planos.add(risco_fk.id) # Adiciona o ID numérico ao conjunto
# Debugging: Print all risks linked to action plans
print("Planos de Ações - RiscosFK:")
for risco_fk in planos_de_acoes.RiscosFK:
print(f"- {risco_fk}")
# Debugging: Print the set created
print("Set of Risk IDs with Action Plans:")
print(riscos_com_planos)
data_atual = datetime.now().date()
ultrapassados_por_celula = {}
sem_planos_por_celula = {}
# Variáveis para contagem de riscos totais e documentados (impacto/probabilidade zero)
total_riscos = 0
riscos_documentados = 0
# --- Adições Finalizadas ---
# Percorrer todos os riscos
for risco in todos_riscos:
# Obter a probabilidade e impacto atuais
ultimo_impac = list(Analise_Risco.lookupRecords(RiscoFK=risco.id, sort_by="Data_Analise").ImpactNum)
impacto_atual = ultimo_impac[-1] if ultimo_impac else risco.Impacto_Inerente_Num
ultima_prob = list(Analise_Risco.lookupRecords(RiscoFK=risco.id, sort_by="Data_Analise").ProbNum)
probabilidade_atual = ultima_prob[-1] if ultima_prob else risco.Probabilidade_Inerente_Num
# Contagem de riscos totais
total_riscos += 1
# Contagem de riscos documentados (probabilidade ou impacto zero)
if impacto_atual == 0 or probabilidade_atual == 0:
riscos_documentados += 1
continue # Pula os riscos com impacto ou probabilidade zero
# Índices inteiros para a matriz
impacto_idx = int(impacto_atual)
probabilidade_idx = int(probabilidade_atual)
# Atualizar o contador na matriz
chave = (probabilidade_idx, impacto_idx)
contagem_matriz[chave] = contagem_matriz.get(chave, 0) + 1
# Adicionar o risco à lista de riscos nessa célula
riscos_por_celula.setdefault(chave, []).append(risco)
# --- Adições Iniciadas ---
if risco.id not in riscos_com_planos:
sem_planos_por_celula[chave] = sem_planos_por_celula.get(chave, 0) + 1
else:
# Debugging: Print the risk ID that has an action plan
print(f"Risk {risco.id} has an action plan.")
analises = Analise_Risco.lookupRecords(RiscoFK=risco.id, sort_by="Data_Analise")
if analises:
ultima_analise = analises[-1]
data_proxima = ultima_analise.Data_Proxima_Analise
if data_proxima and data_proxima < data_atual:
ultrapassados_por_celula[chave] = ultrapassados_por_celula.get(chave, 0) + 1
# --- Adições Finalizadas ---
def obter_cor_risco(risk_score):
if risk_score == 0:
return ('#d3d3d3', 'Inexistente')
elif risk_score <= 2:
return ('#157AFB', 'Muito Baixo')
elif risk_score <= 5:
return ('#2AE028', 'Baixo')
elif risk_score <= 10:
return ('#E8D62F', 'Moderado')
elif risk_score <= 16:
return ('#FD9D28', 'Elevado')
else:
return ('#E00A17', 'Extremo')
risco_selecionado = rec
ultimo_impac_sel = list(Analise_Risco.lookupRecords(RiscoFK=risco_selecionado.id, sort_by="Data_Analise").ImpactNum)
impacto_atual_sel = ultimo_impac_sel[-1] if ultimo_impac_sel else risco_selecionado.Impacto_Inerente_Num
ultima_prob_sel = list(Analise_Risco.lookupRecords(RiscoFK=risco_selecionado.id, sort_by="Data_Analise").ProbNum)
probabilidade_atual_sel = ultima_prob_sel[-1] if ultima_prob_sel else risco_selecionado.Probabilidade_Inerente_Num
impacto_idx_sel = int(impacto_atual_sel)
probabilidade_idx_sel = int(probabilidade_atual_sel)
chave_selecionada = (probabilidade_idx_sel, impacto_idx_sel)
max_valor = 5
html = '<table style="border-collapse: separate; border-spacing: 2px; width: 100%; height: 100%; table-layout: fixed;">'
# Mesclar as células 2x2 no topo e exibir contagens
html += f'''
<tr>
<th rowspan="2" colspan="2" style="background-color: #4f4f4f; width: 80px; height: 100px; border: 1px solid white; border-radius: 8px; box-shadow: inset 0 0 0 2px #3d3d3d; color: white; text-align: center; vertical-align: middle;">
<div>⚠️ {total_riscos}</div>
<div>📄 {riscos_documentados}</div>
</th>
<th colspan="5" style="background-color: #4f4f4f; color: white; text-align: center; border: 1px solid white; border-radius: 8px; box-shadow: inset 0 0 0 2px #3d3d3d;">IMPACTO</th>
</tr>
'''
html += '<tr>'
for prob in range(1, max_valor + 1):
html += f'<th style="background-color: #4f4f4f; color: white; text-align: center; width: 80px; border: 1px solid white; border-radius: 8px; box-shadow: inset 0 0 0 2px #3d3d3d;">{prob}</th>'
html += '</tr>'
for i in range(max_valor, 0, -1):
if i == max_valor:
html += '<tr>'
html += '<th rowspan="5" style="background-color: #4f4f4f; color: white; text-align: center; vertical-align: middle; writing-mode: vertical-rl; transform: rotate(180deg); border: 1px solid white; border-radius: 8px; box-shadow: inset 0 0 0 2px #3d3d3d;">PROBABILIDADE</th>'
html += f'<th style="background-color: #4f4f4f; color: white; text-align: center; width: 40px; border: 1px solid white; border-radius: 8px; box-shadow: inset 0 0 0 2px #3d3d3d;">{i}</th>'
for prob in range(1, max_valor + 1):
chave = (prob, i)
count = contagem_matriz.get(chave, 0)
risk_score = prob * i
cor_celula, nivel_risco = obter_cor_risco(risk_score)
def escurecer_cor(cor):
cor_rgb = tuple(int(cor.lstrip('#')[j:j+2], 16) for j in (0, 2, 4))
cor_rgb_escura = tuple(max(int(c * 0.8), 0) for c in cor_rgb)
return f'rgb{cor_rgb_escura}'
cor_borda = escurecer_cor(cor_celula)
is_selected_cell = (prob, i) == chave_selecionada
cell_style = f'background-color: {cor_celula}; border-radius: 8px; box-shadow: inset 0 0 0 2px {cor_borda}; border: 1px solid white; position: relative; height: 50px;'
if is_selected_cell:
cell_style += ' outline: 3px solid black;'
riscos_na_celula = riscos_por_celula.get(chave, [])
if riscos_na_celula:
tooltip_lines = [f"Riscos nesta célula:"]
for r in riscos_na_celula:
tooltip_lines.append(f"ID: {r.id}, Nome: {r.NomeRisco}")
tooltip_text = '
'.join(tooltip_lines)
else:
tooltip_text = "Nenhum risco nesta célula"
tooltip_text = tooltip_text.replace('"', '"')
sem_planos = sem_planos_por_celula.get(chave, 0)
ultrapassados = ultrapassados_por_celula.get(chave, 0)
html += f'<td style="{cell_style}" title="{tooltip_text}">'
html += f'<div style="width: 100%; height: 100%; display: flex; align-items: center; justify-content: center;">'
if count > 0:
html += f'<div style="background-color: rgba(255, 255, 255, 0.75); border: 2px solid #333; border-radius: 50%; width: 40px; height: 40px; display: flex; align-items: center; justify-content: center; font-weight: bold; font-size: 16px;">{count}</div>'
else:
html += ' '
html += '</div>'
if sem_planos > 0:
html += f'''
<div style="
position: absolute;
top: 2px;
right: 2px;
background-color: #FF0000;
color: white;
font-size: 10px;
padding: 2px 4px;
border-radius: 50%;
pointer-events: none;
border: 1px solid black;">
{sem_planos}
</div>
'''
if ultrapassados > 0:
html += f'''
<div style="
position: absolute;
bottom: 2px;
right: 2px;
background-color: #FFA500;
color: white;
font-size: 10px;
padding: 2px 4px;
border-radius: 50%;
pointer-events: none;
border: 1px solid black;">
{ultrapassados}
</div>
'''
html += '</td>'
html += '</tr>'
html += '</table>'
# Botão Legenda com Tooltip
html += '''
<div style="margin-top: 10px; display: inline-block;">
<button style="padding: 5px 10px; border: none; background-color: #4f4f4f; color: white; border-radius: 5px; cursor: pointer;" title="Registro de Riscos
⚠️ Total de Riscos
📄 Somente Documentados
Células da Matriz
⚪ Riscos na célula
🔴 Riscos sem planos de ação
🟠 Riscos com prazo ultrapassado
Graus de Risco
🟦 Muito Baixo
🟩 Baixo
🟨 Moderado
🟧 Elevado
🟥 Extremo">
Legenda
</button>
</div>
'''
return html
return gerar_matriz_riscos()
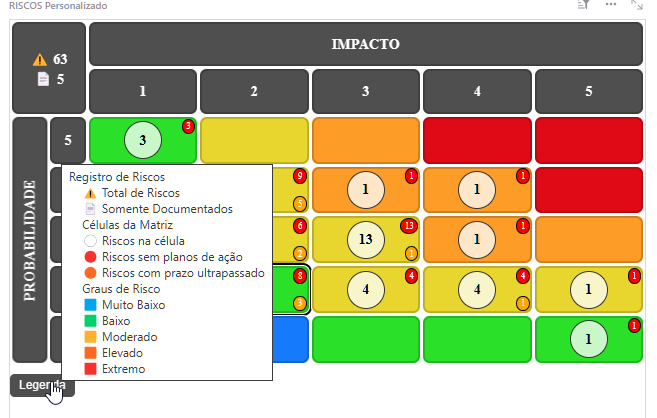
it should result in this
I used the eval() and formula as text per Bibo’s suggestion
that’s why that specific reply was to him. It works with simpler formulas however. Like in the example in his link
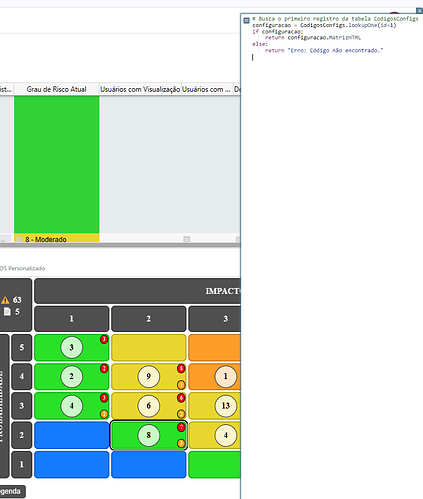
I had already made it work with one of the Risk Matrix
see, very small code in the column
referencing this formula at another table
HOWEVER
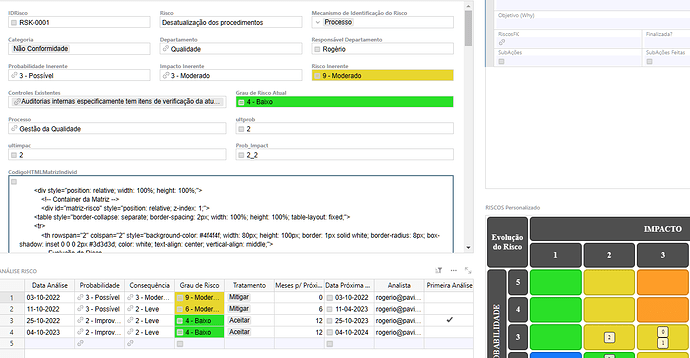
this other Risk Matrix (for individual selected risks, showing the evolution of the risk according to Risk Analysis)
I had to put directly in the main RIsks table
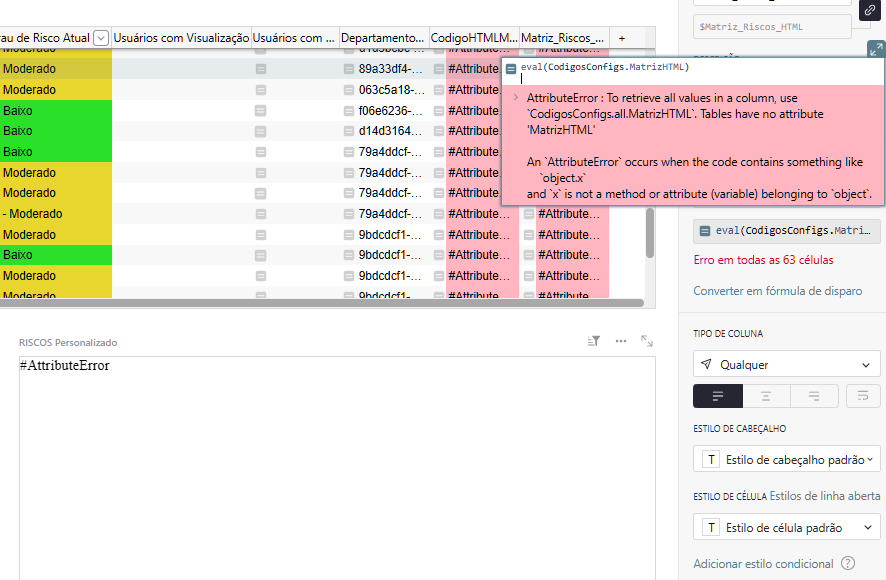
if I put that formula in another table I get an attribute error
Probably because THIS formula tries to access the currently selected record in the Risks table, but the formula is being executed from the context of that other table only for formulas.
btw, in my “formulas table”, I created four columns for testing.
two columns for each Risk Matrix formula. One column as formula, another as text. Then tried both methods with each code.
