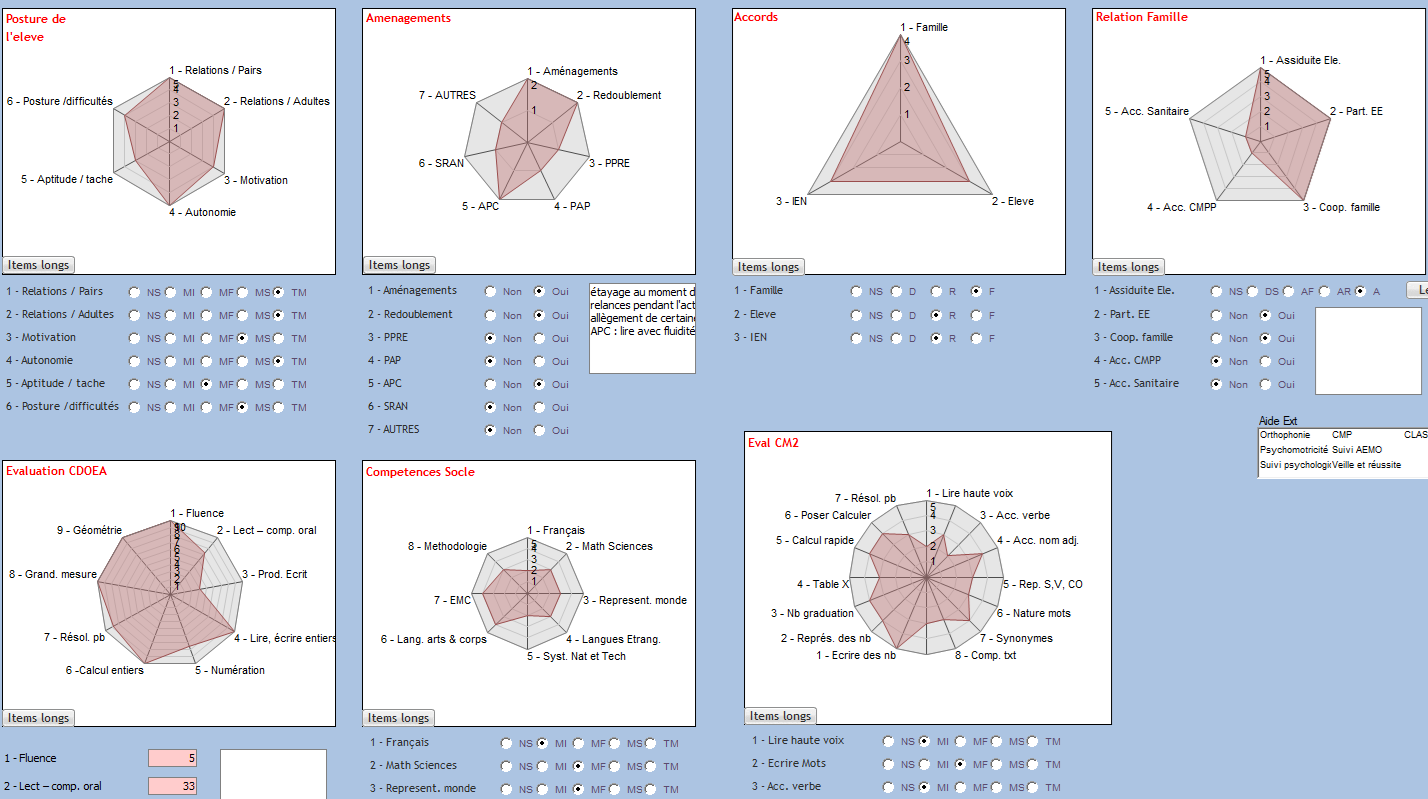
Hi, I need to visualise several scores (mostly from 0 to 5), 3 to 5 items for 7 subjects, to analyse students files to choose whether or not they can integrate specialised learning units.
I can’t manage to do that for the moment for I need students to by in lines and scores in columns and graphic widgets only allow me to pick one score by chart. (don’t know if it’s clear enough )
Well, I tried everything I could think of without writing code and couldn’t find a solution.
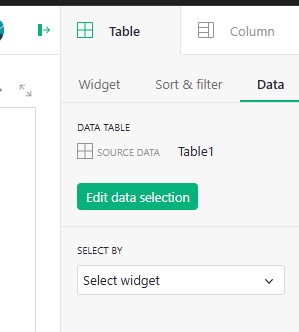
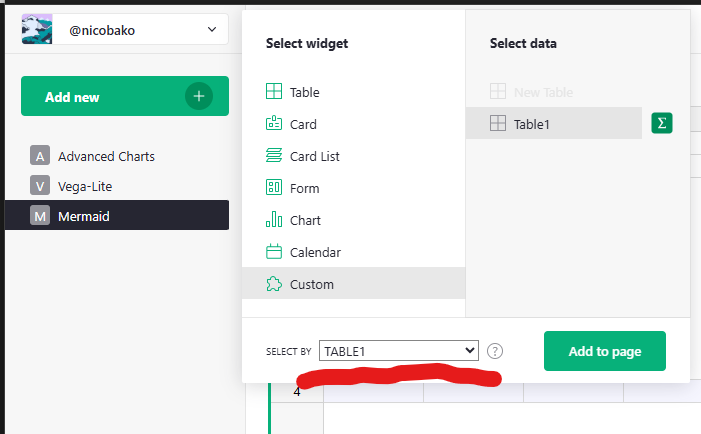
For posterity, here’s my document where I tried using:
The Advanced Charts widget - this should have worked with the polar scatter chart type, but the GUI doesn’t let configure it properly.
The Vega-Lite custom widget - the “lite” version doesn’t have radar charts built in. There’s a hack someone made that renders them but it would take some work to properly integrate.
A mermaid.js viewer - could work, but would need to host a widget with the current version of mermaid.js, as radar plots are new.
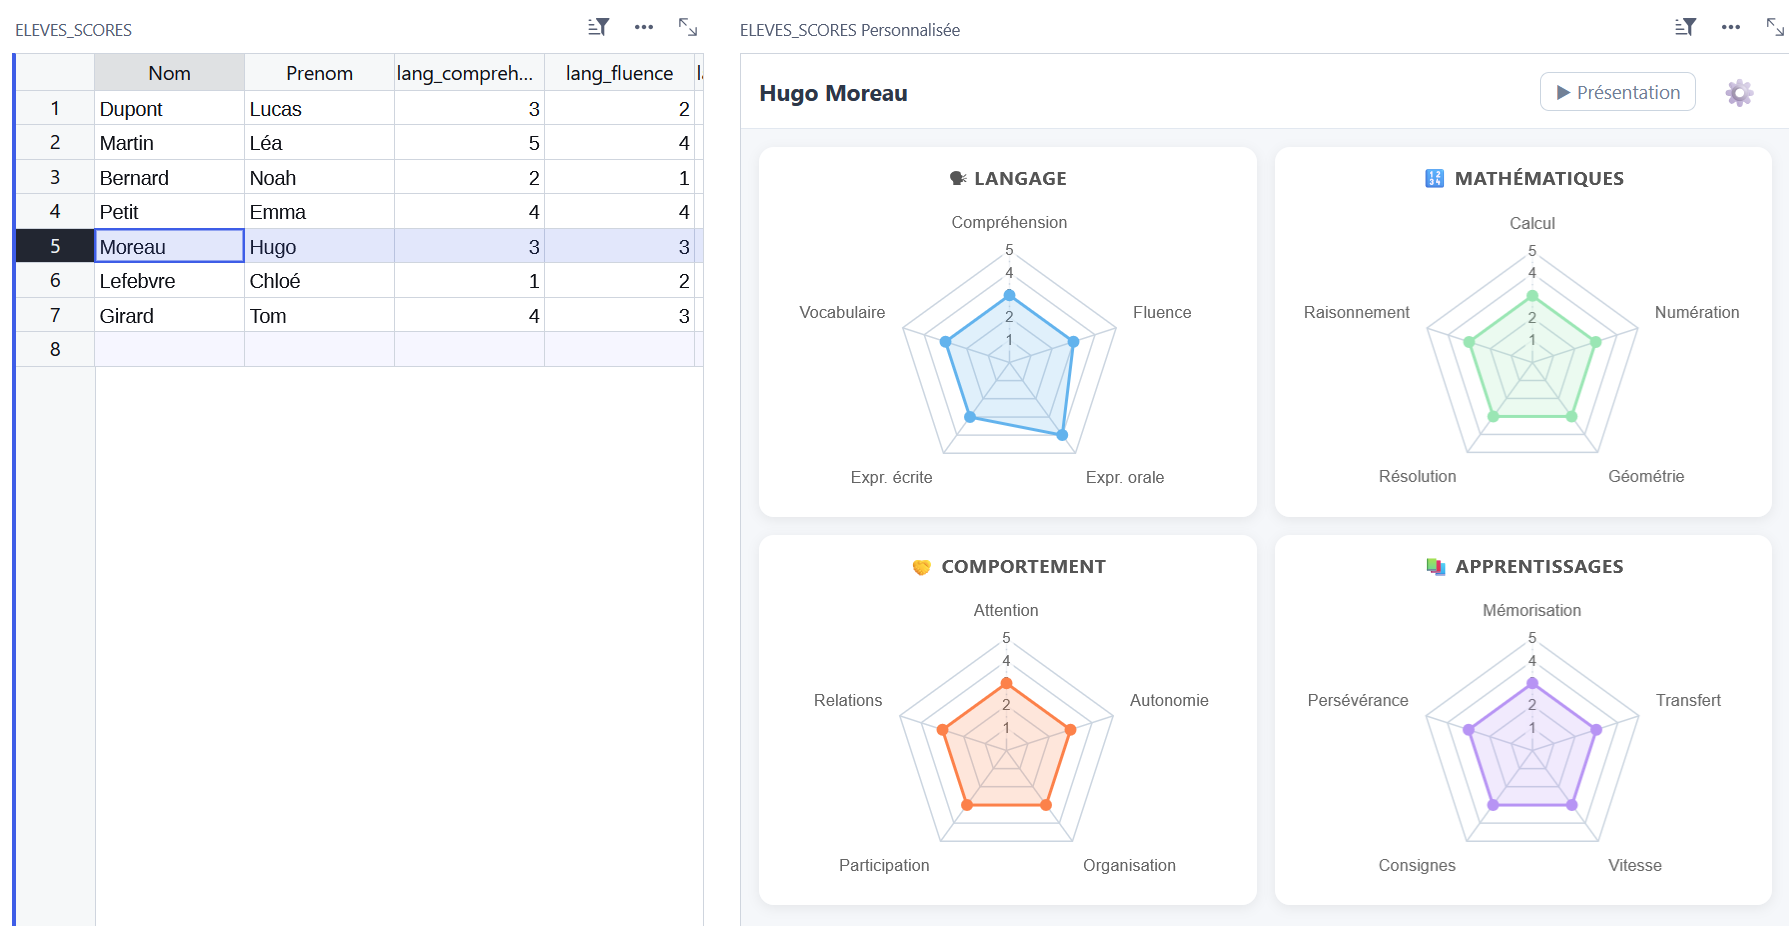
I’ve updated the demo so that it pulls the data from Grist properly. Not a huge fan of the mermaid styling, and I think you’d need to fork the widget to change the mermaid config for rendering sizes, but I’m not 100% sure.