Hello -
Wondering if anyone has any suggestions in terms of conducting some statistical analysis on data held in Grist? thinking e.g. of how to add a best-fit line into a chart or determining covariance / correlation levels between variables etc?
Might be that it’s beyond the Scope of Grist but keen to hear if anyone has any suggestions.
Thanks
determining covariance / correlation levels between variables
You could make a summary table and add a formula to it using the standard Python statistics module:
import statistics
statistics.covariance($group.x, $group.y)
1 Like
With the suggested code I seem to be getting an import error. Any thoughts on why that might be?
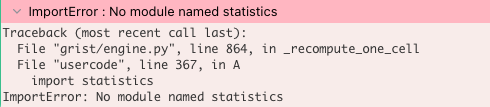
Your document is likely using Python 2. Take a look at Python versions - Grist Help Center
1 Like
Sorry - one more question. Is there a way that I can determine which version of the statistics module is being imported? I don’t seem to have access to some of the functions/attributes that have been added in the more recent releases.
Ah, you’re out of luck! Grist uses Python 3.9, and the functions covariance, correlation, and linear_regression say “New in version 3.10”. Noted this as a push to upgrade to 3.10.
1 Like
Grist now uses Python 3.11, so you can use the statistics module!
Ah good news. Thanks for the heads up. I’ll take it for a spin when i get a chance…
There’s now a way to do this, see here for an example.
