Hello Julien,
I can envisage developing the widget to accept a date column (without time). I also plan to offer a true Gantt view with dependency management. However, I have no idea when this will be ready, so it is best not to count on it initially.
Je peux envisager une évolution du Widget pour accepter une colonne de date (sans heure). Par ailleurs j’ai le projet de proposer une vraie vue Gantt avec gestion des dépendances. Cependant je n’ai pas la moindre idée d’une date de réalisation, il ne vaut donc mieux pas compter dessus dans un premier temps.
Raphaël
Hi Raphaël,
Thanks a lot for your reply!
It’s great to hear that you’re planning to develop both the date-only support and, eventually, a true Gantt view.
I understand it’s a big task — but do you have any rough idea of a timeframe (for example, sometime in 2026 or later)?
To give you a bit of context: I work in the research department of a French hospital.
I’m not a developer, but I’m quite tech-savvy, and since our government introduced GRIST, I’ve been trying to get familiar with the platform and build internal tools.
A Gantt-style tool would be a huge help for us — we currently have no professional project management software.
Here’s what our main needs look like in practice:
- Research projects last between 1 and 3 years (sometimes up to 10 years).
- We mostly manage them on a monthly scale, but we also need to display specific milestones with precise dates.
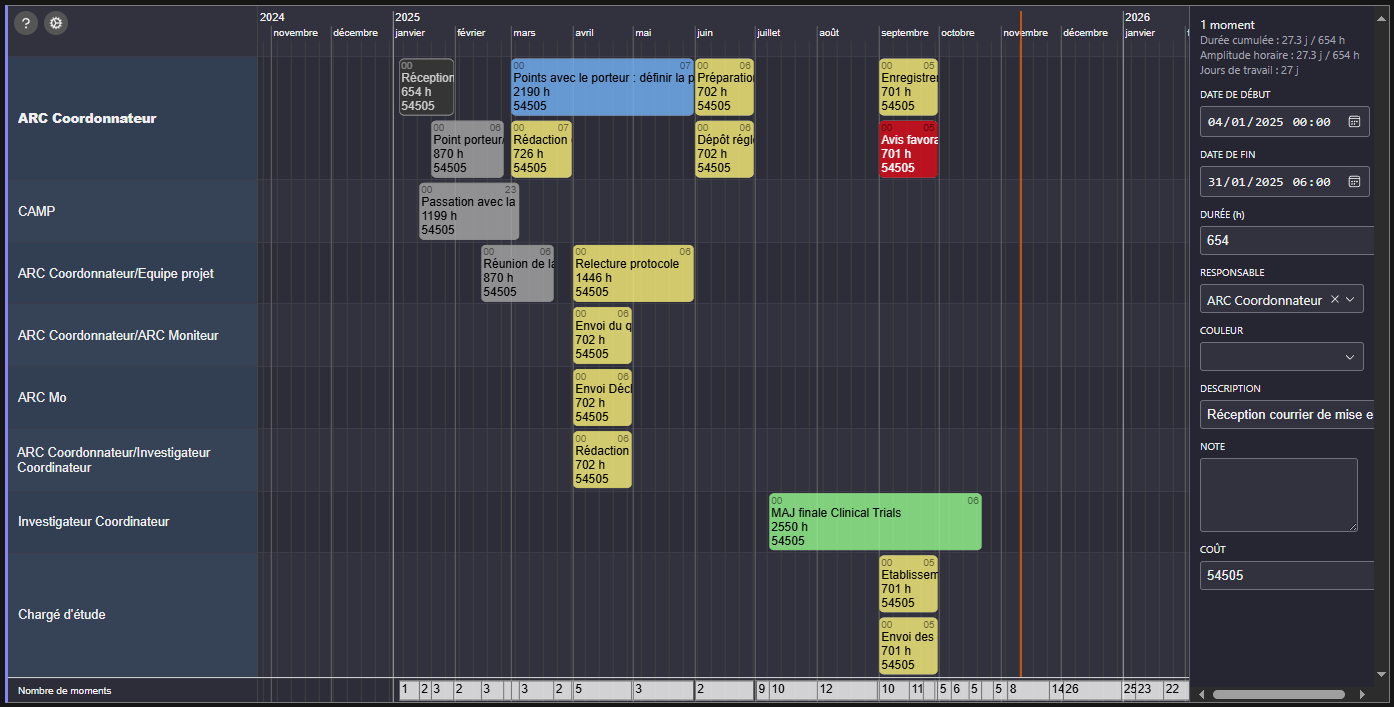
- We’d like to share the Gantt view with project sponsors, which GRIST could make much easier (currently we share Excel Gantt charts through OneDrive — see image below).
- The longer the project runs, the harder it becomes to read; it would help a lot if the task name could stick to the bar, or be displayed next to it instead of inside.
Basically, what you see in the image below — but better!
I’m sharing all this just to help you understand our context, not to request anything right now.
I’d rather you take your time than release a half-measure feature.
Below is an example I made using your widget. You’ll notice the main limitation I face: the task text is cropped, and I currently use the timeline view because the Gantt view doesn’t display the “Activity” field (renamed to “Responsable”).
Ideally, I’d love the Description field to behave like the Notes field, so I could edit and view everything directly from the Gantt view.
Thanks again for your great work — your widget has already been a real game-changer for us.
NB: I’m French, but I’ll keep replying in English so others can follow the discussion.
NB2: I’m currently learning Python (and maybe one day Elm!) since our hospital is facing major financial constraints. We don’t have access to dedicated project management software, so GRIST is our best option to create sustainable internal tools.
Hi Julien,
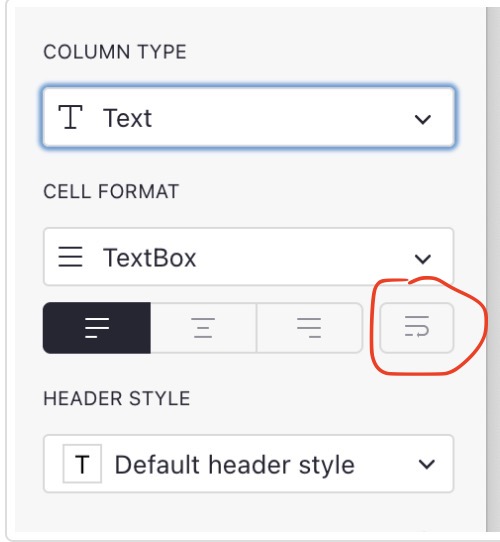
Just a tip : to display the Description field as the Note field, you must enable line breaks in the column configuration, in the ‘Cell format’ section.
I’m not sure I understand this :
the Gantt view doesn’t display the “Activity” field (renamed to “Responsable”)
Have you set up the widget’s “Group_by” option to display the “Responsable” field ?
Hi Raphael,
I didn’t know you could do that no ! That solves one of my problems.
What I mean is that unlike the planning view, on the left (rows) AND on the bars there is the description. In the activity view you have Activité and on the bars Description.
Could you explain whats different between the Timeline view and the Gantt view ? I struggle to differentiate them (besides what I said above).
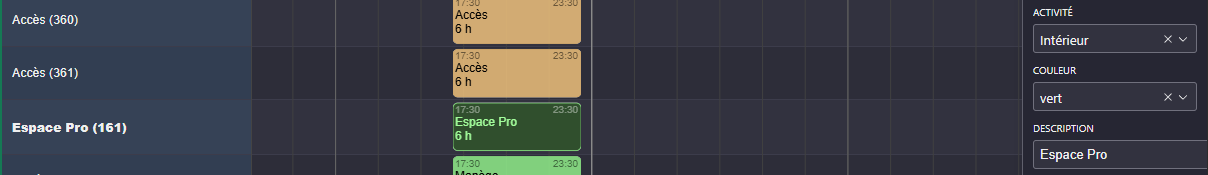
Screenshot of the Gantt view :
For my problem regarding the cropped description, in the meantime I’m thinking I could swap Activité and Description since Activité for me i going to be “Owner” or “Assigned to” which is much shorter text.
Another small request : would it be possible to use the mouse wheel hold to move around (up/down, left/right) ? Or keybind and left or right click hold to move ? It would be much more intuitive.
Julien,
There is no technical difference between the timeline view and the Gantt view. In fact, there is no such thing as a Gantt view. It is simply a configuration of the widget where each task group (the ‘Group by’ option, whose values are displayed on the left side of the timeline) contains only one task. So if you want a single task per line, you need to configure this option with a column from your table where each value is unique. For example, the task title if all the titles are different. You can also use the ‘Then group by’ option to group by another criterion and display it on the left-hand side as well. Is that clearer?
To move around, I have just fixed a bug that prevented some users from moving horizontally with the scroll wheel + Shift.
The current functionality allows you to move around while moving a task or creating a new one. The functionality you suggest would not allow this. It could be complementary, but I will not make it a priority.
Bonjour
Et d’abord bravo pour le travail.
Je voulais juste savoir si vous connaissiez markwhen qui est une super solution de visualisation de timeline.
Raphael,
I’m not really sure I understand correctly. In the timeline view, the “group by” is set to Activité and display Activité. Whereas in the Gantt widget the “group by” is set to Activité but display Description.
Regarding the movement : got it, thanks.
Some other questions :
- Can we set it to display the current day when opening the widget ? It currently show 2024.
- Could you make it so the widget display every Activité if we set the column to Reference list (Reference Multiple) instead of reference ? I’d like to show multiple person in charge of a task.
Markwhen seems nice, but it needs a licence for any work-related activity. Since I need something for my hospital it is work-related… My hospital will never spend a dime for this.
Thanks !
Waouh, I am currently testing the planner and it’s amazing! Thanks a lot
We are using Grist for our small vegetable farm and your tool is a great add on, however there is one key feature that we are missing.
We are using the planner to see when a task should be done (for example planting the potatoe should be done between the 15 march and 25 march).
When a task is resolved it changes color in the planner, but we would also like to see when is the resolution time, by putting a marker on the timeline so that we see when the task was resolve (We plant the potato on the 22 of march).
We use the resolution date to recompute the date of all the subsequent activities (e.g. when to put compost on the potatoes), so it would be amazing if there would also be a draggable “resolution time” marker on the time line.
What do you think, could it be a possible add on to your tool?
Thanks a lot